Network operations center with multiple large screens displaying traffic graphs, topology maps, and status indicators in a dark room with blue ambient lighting
Organizations lose an average of $5,600 per minute during network downtime, according to recent industry research. Without clear visibility into what's moving across your infrastructure, you're flying blind—unable to spot bottlenecks, security breaches, or performance degradation until users start complaining.
A network traffic monitor provides that visibility. It captures, analyzes, and reports on data flowing through your network infrastructure, giving IT teams the intelligence they need to maintain performance, troubleshoot issues, and detect threats before they escalate.
What Is Network Traffic Monitoring
Network traffic monitoring is the process of continuously observing and analyzing data packets moving across network infrastructure. The practice involves deploying specialized software or hardware that intercepts, examines, and logs communication between devices, servers, applications, and external networks.
Core functions include real-time traffic capture, protocol analysis, bandwidth measurement, and anomaly detection. Modern systems process millions of packets per second, extracting meaningful patterns from raw data streams. They identify which applications consume the most bandwidth, which users generate unusual traffic volumes, and whether communication patterns match expected baselines.
Organizations need this visibility for three primary reasons. First, performance optimization—you can't improve what you can't measure. Network administrators use traffic data to identify congestion points, balance loads across links, and plan capacity upgrades based on actual usage rather than guesswork.
Second, security defense. Malware communications, data exfiltration attempts, and unauthorized access all leave network footprints. A properly configured network traffic monitor acts as an early warning system, flagging suspicious patterns like sudden spikes in outbound traffic or connections to known malicious IP addresses.
Third, compliance and auditing. Regulations like HIPAA, PCI DSS, and SOX require organizations to demonstrate control over their data flows. Traffic monitoring provides the audit trails and evidence needed to prove compliance during assessments.
The difference between having monitoring and not having it often becomes clear during incidents. Teams without traffic visibility spend hours guessing at root causes—was it a DDoS attack, a misconfigured router, or just someone streaming 4K video during a critical update? Teams with proper monitoring pull up historical data and pinpoint the exact source within minutes.
Author: Logan Kessler;
Source: baltazor.com
How Network Traffic Analysis Works
Network traffic analysis operates through several technical mechanisms working in concert. The process begins with data collection, typically through one of three methods: port mirroring (SPAN), network taps, or agent-based collection.
Port mirroring copies traffic from one or more switch ports to a monitoring port where analysis software receives the data. This method works well for internal networks but can miss encrypted traffic details. Network taps sit physically between network segments, passively copying all packets without introducing latency or points of failure. Agent-based collection deploys software on endpoints that report traffic statistics back to a central collector.
Once captured, the system performs packet inspection—examining headers and, in some cases, payload data. Headers contain source and destination addresses, protocols, port numbers, and timing information. Deep packet inspection goes further, analyzing payload content to identify specific applications, file types, or suspicious patterns.
Flow data collection offers an alternative to full packet capture. Technologies like NetFlow, sFlow, and IPFIX export summarized records containing key details about each conversation: who talked to whom, when, for how long, and how much data transferred. This approach scales better than full packet capture because it processes metadata rather than complete packets.
Protocols used vary by implementation. SNMP (Simple Network Management Protocol) queries devices for statistics like interface counters and error rates. WMI (Windows Management Instrumentation) gathers data from Windows systems. Syslog collects log messages from network devices. Modern systems often combine multiple protocols to build comprehensive visibility.
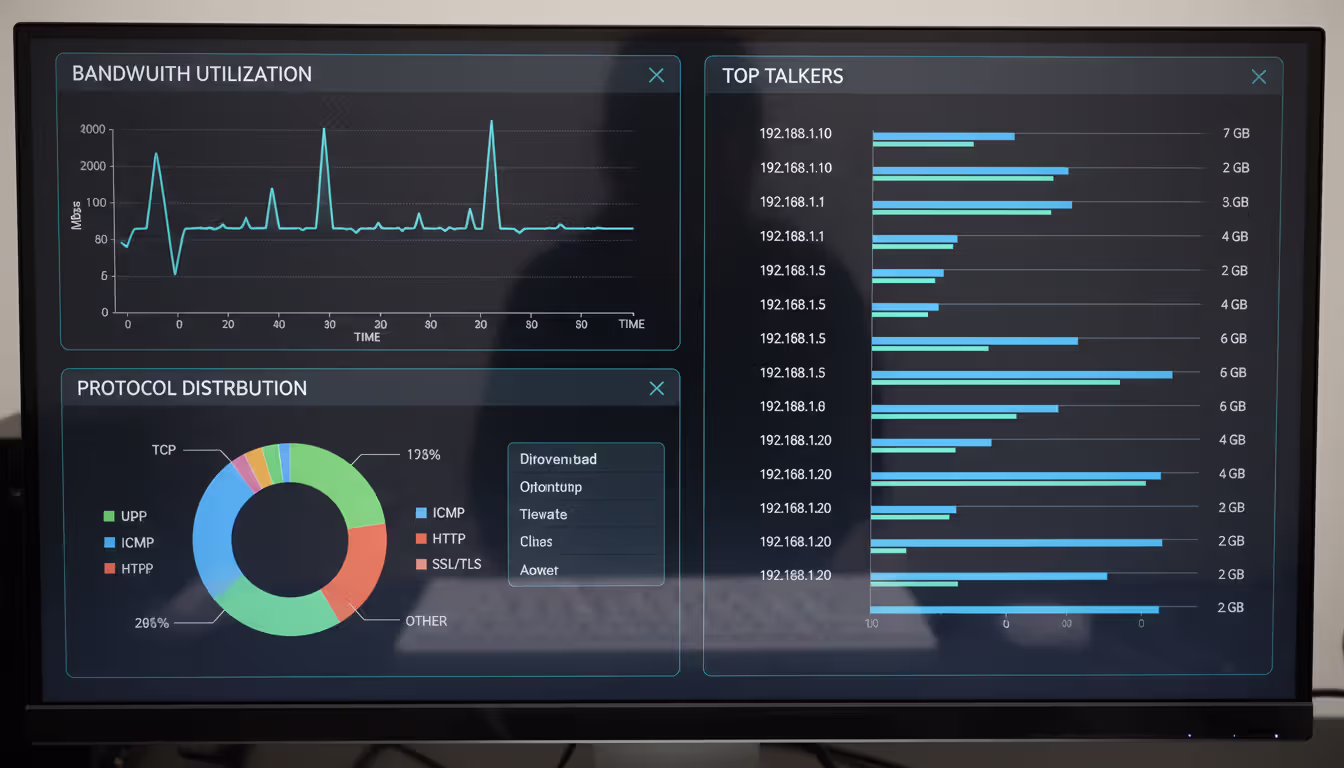
Data visualization transforms raw numbers into actionable intelligence. Traffic flows appear as graphs showing bandwidth consumption over time. Topology maps display network segments with color-coded indicators for health status. Protocol distribution charts reveal whether your network primarily carries web traffic, database queries, video streams, or file transfers.
The analysis engine compares current traffic against established baselines. If your file server normally transfers 2GB per hour but suddenly starts pushing 50GB, the system flags the anomaly. If a workstation begins scanning random IP addresses—behavior typical of compromised machines—alerts fire immediately.
Key Metrics Tracked by Network Traffic Analyzers
Bandwidth usage measures how much data flows through network segments, interfaces, or applications. Most tools display this as bits per second (bps), with breakdowns by protocol, VLAN, or endpoint. Understanding bandwidth consumption helps right-size internet connections, identify capacity constraints, and enforce quality of service policies.
Latency tracks the time packets take to traverse the network. High latency degrades application performance, particularly for real-time services like VoIP or video conferencing. Network traffic analyzers measure round-trip times, jitter (latency variation), and delays between specific endpoints. A sudden latency spike often indicates routing problems, overloaded links, or failing hardware.
Packet loss occurs when data fails to reach its destination. Even small loss percentages—2% or 3%—can cripple TCP-based applications that must retransmit missing segments. Monitoring tools calculate loss rates per interface, path, or application, helping teams isolate whether problems stem from physical layer issues, buffer overflows, or configuration errors.
Protocol distribution shows the mix of traffic types crossing your network. You might discover that 60% of bandwidth goes to HTTPS, 20% to database protocols, 15% to file sharing, and 5% to email. Unexpected protocol distributions often reveal shadow IT—employees using unauthorized cloud services—or malware using uncommon protocols to evade detection.
Top talkers identify the devices, users, or applications generating the most traffic. This metric answers questions like "Why is our internet connection saturated?" or "Which server is hammering our database?" Ranking endpoints by traffic volume quickly surfaces bandwidth hogs, whether they're legitimate (backup jobs, video servers) or problematic (infected machines, rogue streaming).
Additional metrics include connection counts (how many simultaneous sessions exist), DNS query patterns (which domains your network accesses most), and application response times (how long web pages, database queries, or API calls take to complete). Each metric provides a different lens for understanding network behavior.
Author: Logan Kessler;
Source: baltazor.com
Types of Network Traffic Monitor Software
Packet sniffers capture complete packets for detailed analysis. Tools like Wireshark, tcpdump, and Microsoft Network Monitor fall into this category. They excel at troubleshooting specific issues—examining the exact sequence of packets in a failed connection, decoding protocol interactions, or extracting files from captured traffic.
The trade-off is resource intensity. Capturing full packets on a busy network generates massive data volumes. A 10 Gbps link running at 50% capacity produces roughly 2.7 terabytes per hour. Storage and processing requirements make continuous full-packet capture impractical for most organizations. Teams typically use packet sniffers for targeted troubleshooting rather than continuous monitoring.
Flow-based monitors collect summarized records instead of complete packets. NetFlow (developed by Cisco), sFlow (from sFlow.org), and IPFIX (the IETF standard) export metadata about each conversation. A flow record might indicate "192.168.1.50 sent 5MB to 203.0.113.10 over HTTPS between 14:32 and 14:45."
This approach scales to high-speed networks because routers and switches do the heavy lifting—they generate flow records as part of normal operations. The monitoring system simply collects and analyzes the records. Flow-based monitoring works well for traffic accounting, trend analysis, and detecting large-scale anomalies, though it lacks the granular detail needed for deep troubleshooting.
SNMP tools poll network devices for statistics at regular intervals—typically every few minutes. They track interface counters (bytes in/out, errors, discards), CPU utilization, memory usage, and device-specific metrics. SNMP provides a device-centric view rather than a traffic-flow view. You see "this switch port is 80% utilized" rather than "this port carries mostly traffic between the database server and web tier."
SNMP monitoring is lightweight and universal—nearly every network device supports it. However, polling intervals create blind spots. If a five-minute traffic spike occurs between polls, you might miss it entirely. SNMP also struggles with encrypted traffic since it relies on device statistics rather than packet inspection.
Deep packet inspection (DPI) tools analyze payload content, not just headers. They identify specific applications (distinguishing Netflix from YouTube), extract metadata (email subjects, file names), and detect threats (malware signatures, policy violations). DPI enables granular application control and security enforcement but raises privacy concerns and requires substantial processing power.
Cloud-based solutions offload collection and analysis to vendor infrastructure. You deploy lightweight collectors on-premises that forward data to the vendor's platform for processing. This approach eliminates local hardware requirements and provides instant scalability, but introduces latency in data availability and raises questions about sensitive data leaving your network.
On-premise solutions keep all data within your infrastructure. They offer complete control over data retention, privacy, and customization but require upfront hardware investment and ongoing maintenance. Many organizations adopt hybrid approaches—using cloud services for branch offices while keeping core network monitoring on-premise.
Choosing the Right Network Traffic Analysis Tools
Network size directly impacts tool selection. A small office with 50 users and two switches has different needs than an enterprise with 10,000 endpoints across multiple data centers. Small networks can often use free or low-cost tools with manual configuration. Large networks require enterprise platforms with distributed collection, centralized management, and automation capabilities.
Consider your environment's complexity. Flat networks with a single location need simpler solutions than segmented networks spanning multiple sites, cloud providers, and remote workers. If you manage hybrid infrastructure—some on-premise, some in AWS, some in Azure—choose tools that provide unified visibility rather than forcing you to toggle between separate dashboards.
Budget constraints shape decisions but shouldn't be the only factor. Free tools like ntopng, Nagios, or Zabbix work well for organizations with technical expertise to configure and maintain them. Commercial platforms like SolarWinds, PRTG, or ManageEngine cost thousands to tens of thousands annually but include professional support, regular updates, and pre-built integrations.
Calculate total cost of ownership, not just license fees. A "free" solution that requires 20 hours per month of administrator time costs more than a commercial tool that runs autonomously. Factor in hardware (if needed), training, and the opportunity cost of building custom integrations versus buying ready-made connectors.
Compliance requirements may mandate specific capabilities. PCI DSS requires network segmentation monitoring and intrusion detection. HIPAA demands audit trails showing who accessed what data. GDPR restricts how long you can retain traffic records containing personal information. Verify that candidate tools support the logging, retention, and reporting features your compliance regime requires.
Ease of use matters more than vendors admit. A powerful tool that nobody understands sits unused. Evaluate interfaces during trials—can your team build useful dashboards without consulting documentation? Does the alert configuration make sense? Can junior staff run common reports without escalating to senior engineers?
Integration capabilities determine how well the tool fits your existing ecosystem. Does it feed data into your SIEM for security correlation? Can it trigger tickets in your service desk when issues arise? Does it export data to your business intelligence platform for executive reporting? Poor integration creates information silos that reduce overall visibility.
Alerting features separate reactive from proactive monitoring. Look for flexible thresholds (static values, baselines, anomaly detection), multiple notification channels (email, SMS, webhooks), and alert suppression to prevent notification storms. The best systems let you define composite conditions—alert only when bandwidth exceeds 80% AND latency exceeds 100ms AND packet loss exceeds 1%, not when any single condition triggers.
Vendor stability and support quality influence long-term success. A tool that works perfectly today but whose vendor goes out of business next year leaves you stranded. Research vendor financial health, customer retention rates, and support responsiveness. Check user forums and review sites for unvarnished opinions about post-sale support quality.
Author: Logan Kessler;
Source: baltazor.com
Common Network Traffic Monitoring Challenges
Encrypted traffic visibility presents a growing challenge as more protocols adopt encryption by default. HTTPS now accounts for over 90% of web traffic, and many applications use proprietary encrypted protocols. Traditional packet inspection can see that traffic exists but not what it contains—you know a user accessed 203.0.113.50 but not whether they downloaded files, streamed video, or ran database queries.
Solutions include TLS inspection (decrypting traffic at a proxy for analysis, then re-encrypting it) and metadata analysis (inferring application identity from packet timing, sizes, and connection patterns). TLS inspection works but introduces security risks—you're essentially performing a man-in-the-middle attack on your own traffic. Metadata analysis is less invasive but less accurate. Some organizations negotiate with software vendors for application-layer visibility through APIs rather than relying on network inspection.
Scalability issues emerge as networks grow faster than monitoring infrastructure. A monitoring system adequate for 1 Gbps struggles at 10 Gbps and collapses at 100 Gbps. Storage requirements grow exponentially—capturing just flow records from a busy network can generate hundreds of gigabytes daily. Processing power becomes a bottleneck when analyzing millions of flows for anomalies in real time.
Address scalability through architectural planning. Distribute collection across multiple sensors rather than funneling everything to a single collector. Use sampling (analyzing 1 in 100 packets) on high-speed links where full capture isn't necessary. Implement tiered retention policies—keep detailed data for 24 hours, summarized data for 30 days, and aggregate statistics for a year.
False positives plague poorly tuned systems. Alert fatigue sets in when administrators receive dozens of notifications daily, most proving irrelevant. Common causes include overly sensitive thresholds (alerting when bandwidth hits 50% instead of 90%), failure to account for business cycles (legitimate traffic spikes during month-end processing), and lack of context (flagging behavior that's normal for that particular application or user).
Reduce false positives through baseline learning periods—let the system observe normal behavior for weeks before enabling alerts. Implement time-aware thresholds that expect higher traffic during business hours. Create alert grouping so related events generate a single notification instead of dozens. Most importantly, tune continuously based on feedback from your team about which alerts proved actionable.
Resource consumption by monitoring tools themselves can impact network performance. Inline monitoring devices add latency if not properly sized. SNMP polling generates traffic that consumes bandwidth—not much per query, but multiply by thousands of devices and five-minute intervals. Agent-based collection uses CPU and memory on endpoints.
Minimize impact through passive monitoring where possible—use network taps or SPAN ports rather than inline devices. Adjust polling intervals based on device importance—critical infrastructure every minute, edge switches every ten minutes. Right-size monitoring hardware so it processes traffic without introducing delays. Monitor the monitors—track the resource consumption of your monitoring infrastructure to ensure it doesn't become part of the problem.
Data retention policies balance investigative needs against storage costs and privacy regulations. Keeping detailed traffic data for years enables historical analysis and forensic investigations but requires massive storage and may violate data protection laws. Deleting data too quickly leaves you unable to investigate incidents discovered weeks after they occurred.
Establish retention tiers matched to use cases. Real-time data for active troubleshooting (24-48 hours). Daily summaries for trend analysis (90 days). Monthly aggregates for capacity planning (2-3 years). Apply privacy filters that strip personally identifiable information from long-term storage. Document your retention policy for compliance auditors.
Network Traffic Monitor Implementation Steps
Organizations consistently underestimate the value of comprehensive network visibility until they face a major incident.I've watched teams spend weeks investigating breaches that proper traffic monitoring would have detected in hours. The question isn't whether you can afford network traffic analysis tools—it's whether you can afford the blind spots without them. Every hour spent troubleshooting without data is an hour of lost productivity, and every security incident that goes undetected for days instead of minutes multiplies your exposure exponentially
— Sarah Chen
Planning deployment starts with defining objectives. Are you primarily concerned with performance optimization, security threat detection, or compliance reporting? Different goals emphasize different capabilities. Performance monitoring focuses on bandwidth, latency, and application response times. Security monitoring prioritizes anomaly detection and threat intelligence integration. Compliance monitoring emphasizes audit trails and policy enforcement reporting.
Inventory your network infrastructure. Document all network segments, critical links, and choke points where visibility matters most. Identify which devices support flow export, which interfaces can be mirrored for packet capture, and where you can install physical taps if needed. Map out management networks—monitoring traffic shouldn't traverse the same paths as production traffic, or you'll lose visibility during outages.
Sensor placement determines what you can see. At minimum, monitor internet gateways (all traffic entering and leaving your network), data center uplinks (traffic between users and servers), and inter-site links (traffic between offices or cloud regions). For deeper visibility, add sensors at distribution layer switches, server farm aggregation points, and critical application tiers.
Avoid monitoring only at the network edge. Internal threats, lateral movement by attackers, and server-to-server traffic remain invisible if you only watch perimeter links. Balance comprehensive coverage against budget and complexity—start with critical paths and expand over time.
Baseline establishment requires patience. Deploy monitoring in observation mode for at least two weeks, preferably four, before enabling automated alerts. This learning period captures normal daily, weekly, and monthly patterns. You'll discover that backup jobs saturate links every night at 2 AM, month-end reporting spikes database traffic, and Friday afternoons see increased streaming as employees wind down.
Document discovered patterns as baseline expectations. Note traffic volumes per segment, typical protocol distributions, and regular maintenance windows. These baselines become the foundation for anomaly detection—deviations from established patterns trigger investigation.
Alert configuration should start conservative and tighten over time. Begin with alerts for only the most critical issues—complete link failures, extreme bandwidth saturation (95%+), or connections to known malicious IPs. As you build confidence in the system and reduce false positives, add alerts for subtler problems like gradual performance degradation or unusual after-hours activity.
Structure alerts with clear escalation paths. Low-severity issues generate tickets for investigation during business hours. Medium-severity issues page on-call staff. High-severity issues trigger immediate escalation to senior engineers. Include enough context in alerts that responders understand the issue without logging into multiple systems—what's affected, how severe, and what changed recently.
Team training determines whether your investment delivers value. Schedule hands-on sessions where administrators practice common tasks: investigating bandwidth spikes, identifying top talkers, correlating traffic patterns with application performance complaints, and generating compliance reports. Create runbooks documenting response procedures for common alerts.
Author: Logan Kessler;
Source: baltazor.com
Cross-train beyond the networking team. Security analysts need training on using traffic data for threat hunting. Application teams benefit from understanding how to interpret network metrics when troubleshooting performance issues. Help desk staff should know when to escalate issues and what information to collect.
Continuous improvement treats monitoring as an evolving practice. Schedule quarterly reviews of alert effectiveness—which alerts proved most valuable, which generated false positives, what gaps remain in visibility. Update baselines as your network changes through infrastructure upgrades, application migrations, or business growth. Stay current with emerging threats and adjust detection rules accordingly.
What is the difference between network traffic monitoring and network performance monitoring?
Network traffic monitoring focuses specifically on data flows—what packets traverse your network, their sources and destinations, protocols used, and bandwidth consumed. It answers questions about network usage patterns and communication behaviors. Network performance monitoring takes a broader view, measuring end-to-end application performance, user experience metrics, and service availability. Performance monitoring includes traffic analysis but also tracks server response times, database query performance, and application-layer metrics. Many modern platforms combine both capabilities, but the distinction matters when selecting tools—pure traffic monitors excel at visibility into network communications, while performance monitors emphasize application and service health.
How much does network traffic monitor software cost?
Pricing varies dramatically based on network size and feature requirements. Free open-source options like ntopng or Wireshark cost nothing for software but require technical expertise and time investment. Small business solutions range from $500 to $5,000 annually for networks up to 100 devices. Mid-market platforms cost $5,000 to $25,000 yearly for several hundred devices with professional support. Enterprise solutions start at $25,000 and can exceed $100,000 annually for large-scale deployments with thousands of devices, distributed collection, and advanced analytics. Most vendors price per device monitored, per flow-per-second processed, or per gigabit of network capacity. Cloud-based services often use subscription models with monthly fees based on data volume ingested. Calculate total cost including any required hardware, implementation services, training, and ongoing support—not just software licensing.
Can network traffic analyzers detect security threats?
Yes, but with important limitations. Traffic analyzers excel at detecting network-based threats like port scanning, DDoS attacks, unusual connection patterns, communication with known malicious IP addresses, and data exfiltration attempts that generate abnormal traffic volumes. They identify compromised devices exhibiting scanning behavior or beaconing to command-and-control servers. However, they struggle with encrypted payload threats, application-layer attacks that mimic legitimate traffic, and slow-and-low attacks designed to stay under detection thresholds. Most effective security programs combine traffic analysis with endpoint detection, SIEM correlation, and threat intelligence feeds. Traffic monitoring provides one critical layer of defense but shouldn't be your only security control. The value lies in detecting threats that leave network footprints—lateral movement, reconnaissance, and data theft—which often go unnoticed by endpoint-only security.
Do I need special hardware to monitor network traffic?
It depends on your network size and monitoring approach. Small networks can often use software-only solutions running on existing servers or virtual machines, especially for flow-based monitoring where routers and switches do the collection work. Packet capture on high-speed networks (10 Gbps and above) typically requires dedicated hardware with specialized network processors and high-speed storage. Network taps—physical devices that copy traffic without impact—range from $500 for basic copper taps to $10,000+ for high-speed fiber taps. SPAN/mirror ports on existing switches provide a hardware-free alternative but can drop packets under heavy load. Cloud-based monitoring reduces on-premise hardware needs, though you'll still need local collectors. Start with what you have—most organizations can begin monitoring using existing infrastructure—then invest in dedicated hardware as you scale or need deeper visibility into high-speed segments.
How does encrypted traffic affect network traffic analysis?
Encryption hides payload content, limiting what traffic analyzers can see. With HTTPS, SSH, or VPN traffic, monitors observe connection metadata—source and destination IPs, ports, timing, and data volumes—but not the actual content being transferred. You can tell a user accessed a cloud storage service but not which files they uploaded. This limitation has grown as encryption adoption increased; most web traffic now uses TLS 1.3, which encrypts even more handshake data than earlier versions. Workarounds include TLS inspection (decrypting traffic at a proxy for analysis), though this introduces security risks and breaks certificate pinning. Encrypted Traffic Analysis uses machine learning to identify applications from encrypted traffic patterns—packet sizes, timing, and connection behaviors create fingerprints that reveal application identity without decryption. Some vendors negotiate API access to cloud services for visibility without network inspection. Accept that modern monitoring provides less granular visibility than in pre-encryption days, and design your approach accordingly.
What industries require network traffic monitoring for compliance?
Healthcare organizations must monitor network traffic under HIPAA to detect unauthorized access to protected health information and demonstrate security controls during audits. Financial services firms face PCI DSS requirements for payment card data, which mandate network segmentation monitoring and intrusion detection. SOX compliance for publicly traded companies requires demonstrating controls over financial data systems, including audit trails of network access. Government contractors dealing with controlled unclassified information must implement NIST 800-171 controls, many of which involve network monitoring. Energy sector organizations follow NERC CIP standards requiring monitoring of critical infrastructure networks. European organizations under GDPR must demonstrate data protection measures, including monitoring for unauthorized data transfers. Defense contractors working with classified information face CMMC requirements that include comprehensive network visibility. Even industries without specific mandates often implement traffic monitoring for cyber insurance requirements—many policies now require evidence of security controls including network monitoring as a condition of coverage.
Network traffic monitoring transforms invisible data flows into actionable intelligence. The practice provides the visibility needed to optimize performance, detect security threats, and meet compliance obligations. While implementation requires careful planning and ongoing tuning, the alternative—managing networks blindly—exposes organizations to preventable outages, undetected breaches, and inefficient resource utilization.
Success depends on matching tools to requirements, starting with clear objectives and realistic scope. Begin monitoring critical paths, establish baselines before enabling alerts, and expand coverage as you build expertise. The most sophisticated monitoring platform delivers no value if your team can't interpret its data or respond to its alerts.
Treat network traffic monitoring as a continuous practice rather than a one-time project. Networks evolve, threats change, and business requirements shift. Regular reviews ensure your monitoring strategy adapts alongside your infrastructure. The investment in visibility pays dividends every time you resolve an issue in minutes instead of hours, detect a threat before it causes damage, or demonstrate compliance without scrambling to collect evidence.
When you print thousands of product labels or engrave a QR code onto a memorial plaque, that code must work indefinitely. Learn which QR code types never expire, how to generate permanent codes, and mistakes that can make even 'permanent' codes fail
Network infrastructure failures cost enterprises an average of $9,000 per minute in 2026. This comprehensive guide covers network monitoring fundamentals, tool selection, deployment options, and alert configuration best practices to help organizations maintain optimal network performance
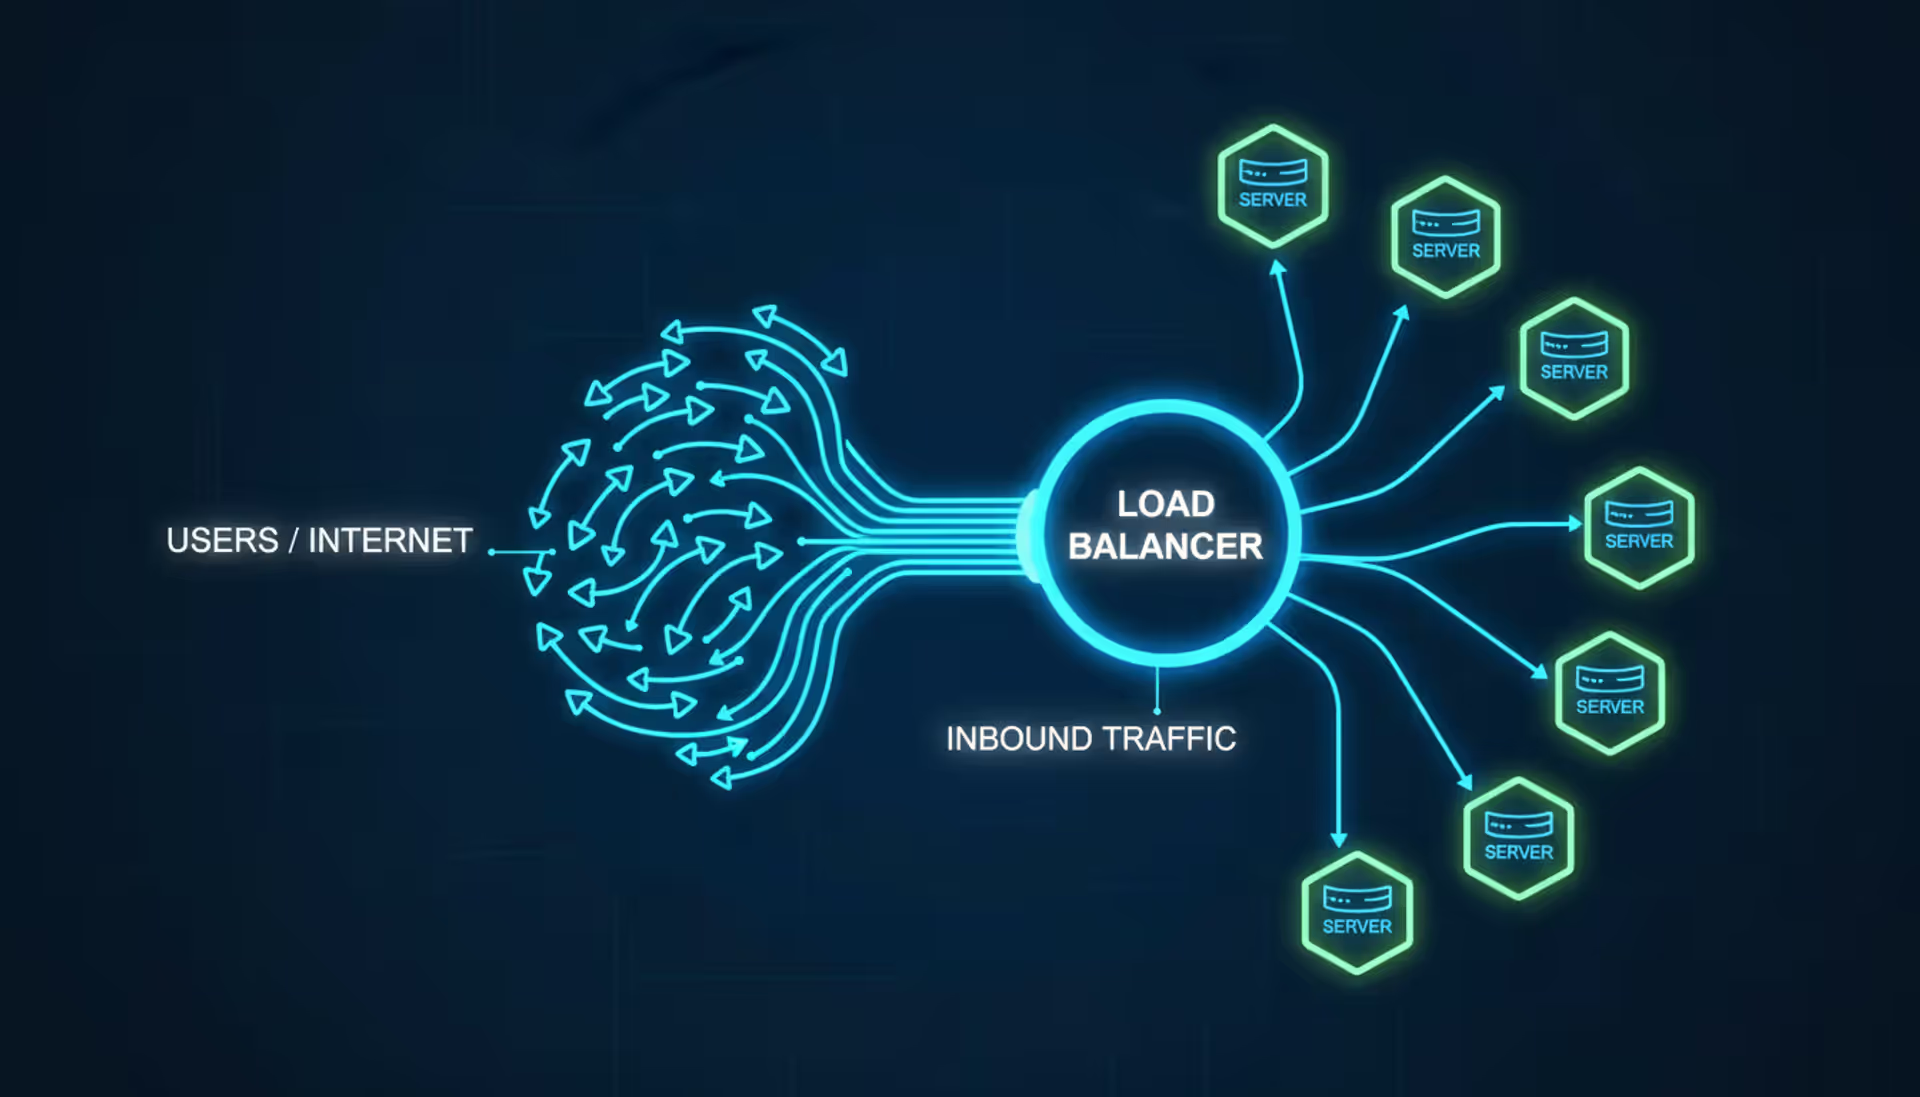
Load balancers distribute network traffic across multiple servers to prevent overload and ensure high availability. This guide covers load balancer architecture, algorithms, DNS-based methods, cloud services vs on-premises solutions, and implementation best practices for modern infrastructure
Deploying connected devices across states or countries requires more than a standard cellular plan. An internet of things sim card provides specialized connectivity for sensors, trackers, and industrial equipment—often for years without manual intervention
The content on this website is provided for general informational and educational purposes only. It is intended to explain concepts related to cloud computing, computer networking, infrastructure, and modern IT systems.
All information on this website, including articles, guides, and examples, is presented for general educational purposes. Technology implementations may vary depending on specific environments, business needs, infrastructure design, and technical requirements.
This website does not provide professional IT, engineering, or technical advice, and the information presented should not be used as a substitute for consultation with qualified IT professionals.
The website and its authors are not responsible for any errors or omissions, or for any outcomes resulting from decisions made based on the information provided on this website.