Modern network operations center with large wall-mounted displays showing network topology maps, performance graphs, and status indicators, IT professionals working at monitoring stations in dimly lit room
Here's a number that should make any IT manager nervous: when enterprise networks go down, companies lose roughly $9,000 every single minute. What's worse? Most of these disasters didn't have to happen. The culprit is usually poor visibility into what's actually happening across the network.
Today's IT environments are messy. You've got servers in your own data center, workloads running in AWS, a handful of applications in Azure, employees working from coffee shops, and probably a growing collection of IoT gadgets nobody in IT even knows about. Keeping all of this running smoothly requires constant vigilance—which is exactly what network monitoring delivers.
What Is Network Monitoring?
Think of network monitoring as having security cameras installed throughout your network infrastructure. Instead of watching for burglars, you're watching for performance problems, connectivity failures, and unusual behavior that might signal bigger issues.
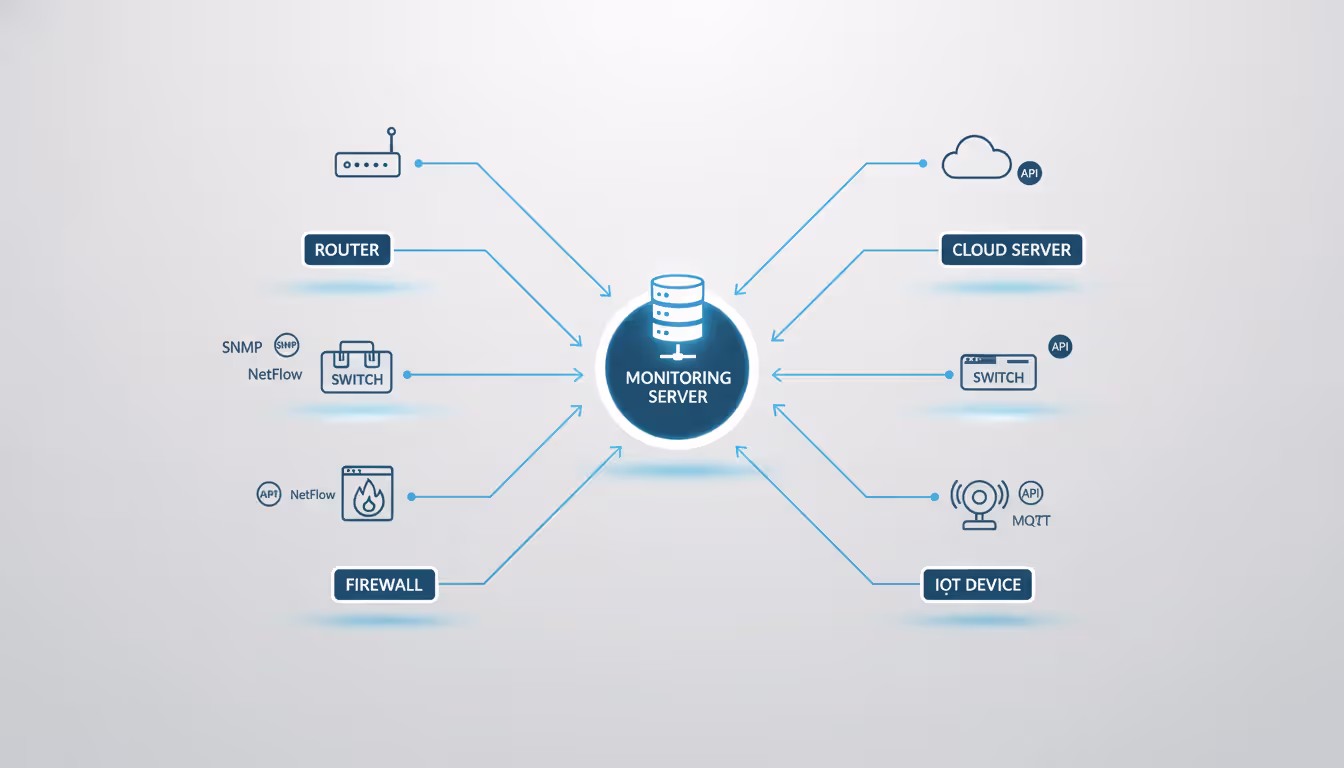
The practice involves keeping tabs on your routers, switches, firewalls, servers, wireless equipment, and everything else connected to your network. These systems constantly generate information about how they're performing—monitoring tools collect this information, make sense of it, and tell you when something needs your attention.
Why bother with all this? Three big reasons stand out.
Revenue protection tops the list. Imagine your e-commerce platform crashing during Black Friday. Every minute offline translates directly into abandoned shopping carts and frustrated customers heading to your competitors. Payment processors, in particular, can't afford even brief outages—fifteen minutes of downtime might mean thousands of failed transactions.
Service level agreements represent the second driver. Maybe you've promised customers 99.9% uptime, or your internal teams have committed to keeping critical applications available during business hours. Without monitoring, you're flying blind—you won't even know you've violated your SLA until someone complains.
Third, there's the troubleshooting advantage. When things break (and they will), having detailed historical data transforms the diagnostic process from guesswork into detective work. You can see exactly what happened in the minutes leading up to the failure.
Plus, those historical records become invaluable during security investigations, capacity planning discussions, and budget meetings where executives demand proof that you actually need that expensive network upgrade.
How Network Monitoring Tools Work
Monitoring solutions use two basic approaches: actively poking your network infrastructure to see how it responds, and passively observing traffic that's already flowing. Most products combine both methods.
Gathering Information
SNMP—Simple Network Management Protocol—does the heavy lifting for most monitoring platforms. Nearly every piece of network gear manufactured in the past twenty years includes an SNMP agent that responds to status queries. Your monitoring server asks questions every few minutes: "How much bandwidth are you using? What's your CPU running at? Seeing any errors?" The device answers, and the monitoring tool records the response.
Flow protocols take a different angle. Technologies like NetFlow (Cisco's invention), sFlow, and IPFIX create records describing network conversations—who's talking to whom, which applications they're using, how much data they're transferring. You get visibility into traffic patterns without actually recording the conversations themselves.
Deep packet inspection goes a step further by capturing real network traffic. This approach chews through resources quickly, so most deployments use it selectively—triggered only when investigating specific problems or monitoring particularly critical applications.
API connections have exploded in importance as infrastructure becomes more software-defined. Cloud platforms don't speak SNMP, but they expose detailed telemetry through REST APIs. Same goes for modern SD-WAN controllers, container orchestration platforms, and virtualization hosts.
Author: Chloe Bramwell;
Source: baltazor.com
Alert Mechanisms
Simple threshold violations—"CPU above 90%"—create more problems than they solve. You'll drown in false alarms within a week.
Better configurations require multiple conditions: alert only when CPU exceeds 90% for ten consecutive minutes AND memory utilization tops 85% simultaneously. This combination logic dramatically cuts down on spurious notifications.
Escalation rules match alert severity to the appropriate response. Minor warnings might get logged to a shared email alias that someone checks during business hours. Critical database failures? That should trigger text messages to whoever's on call, escalating to their manager if nobody acknowledges the alert within fifteen minutes.
The smartest systems learn what "normal" looks like for your environment. Instead of rigid thresholds, they recognize patterns—60% CPU usage at 2 PM on Tuesday is fine, but the same number at 3 AM Sunday morning deserves investigation.
Visualization and Reports
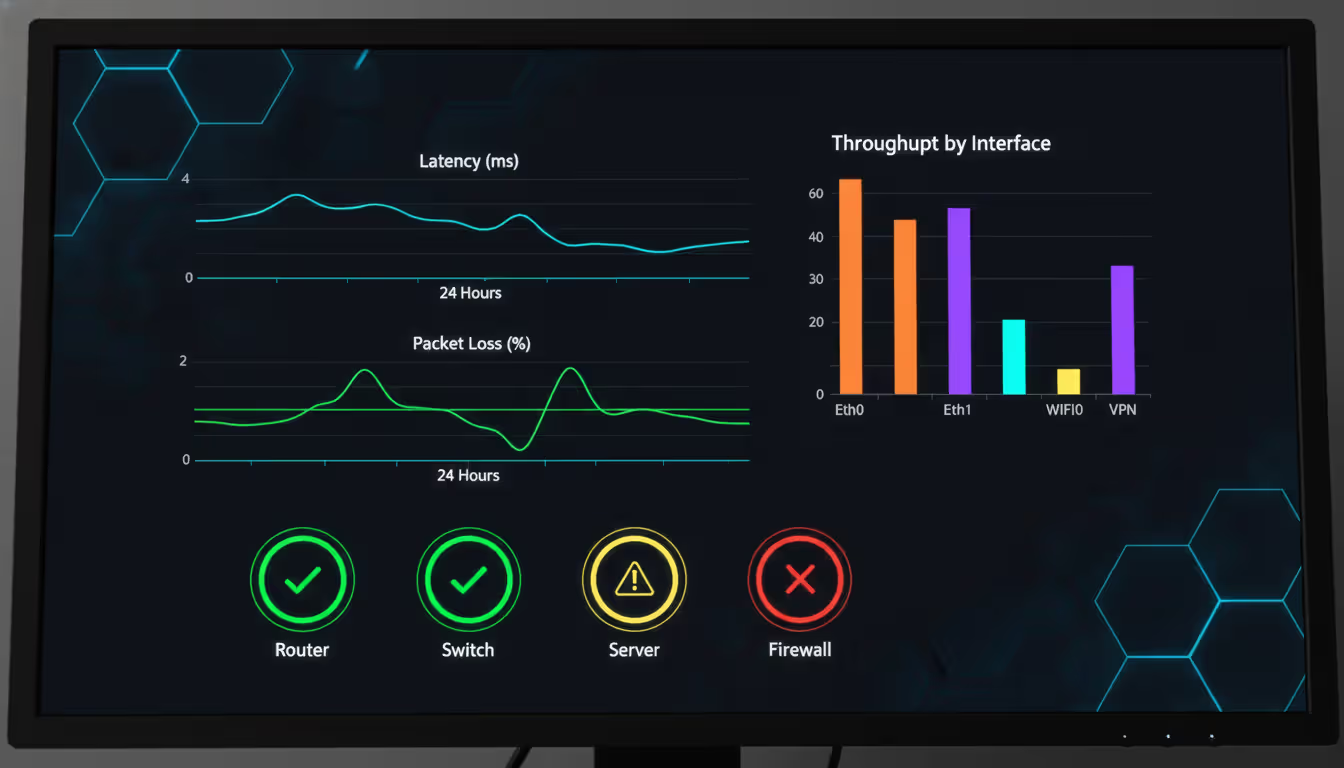
Real-time dashboards show current conditions at a glance. Many operations teams maintain wall-mounted displays that everyone can see—green means everything's fine, red means we've got problems, amber means something needs watching.
Drill-down capabilities let you start at the big picture and click through to specific details. Your WAN dashboard shows overall traffic levels, but you can dig into individual circuits, then specific applications using bandwidth on those circuits, all the way down to which users are generating that traffic.
Scheduled reports handle the compliance and planning side of things. These run weekly or monthly, aggregating data into trends rather than showing momentary snapshots. Executives get summaries of network performance. Capacity planners get utilization forecasts. Auditors get proof that security policies are actually enforced.
Types of Network Monitoring
Most organizations run several monitoring types simultaneously because each answers different questions.
Availability Checks
The most basic question: is this thing even reachable right now? Ping tests verify that devices respond to ICMP packets. Port checks confirm that specific services are listening—your web server should answer on port 443, your database on port 3306.
Simple? Yes. Useless? Not even close. Knowing immediately when critical systems go offline prevents those situations where outages continue for hours because everyone assumed someone else was watching.
The catch: a server can respond to pings while the actual application running on it has crashed. That's why you need additional monitoring layers.
Performance Tracking
This measures how well things are working, not just whether they're working. Key metrics include latency (how long packets take to reach their destination), jitter (inconsistency in latency), packet loss percentages, and actual throughput.
Performance monitoring often catches problems before they become emergencies. Response times creeping upward over several days might indicate a link approaching saturation—fix it now during a maintenance window rather than dealing with an emergency outage later.
Application response time monitoring simulates real user activity. Synthetic transactions might log into your web application every five minutes, navigate through several pages, submit a form, and time each step. If this test starts taking twice as long as normal, you know users are experiencing slowdowns even if nobody's complained yet.
Author: Chloe Bramwell;
Source: baltazor.com
Bandwidth Analysis
Who's using all your network capacity? Bandwidth monitoring answers this question definitively.
It identifies top talkers (which hosts send the most data), top protocols (turns out video streaming dominates your WAN links), and usage patterns over time. This information drives intelligent decisions about infrastructure investments.
Should you upgrade that circuit to 10 Gbps? Maybe, but bandwidth monitoring might reveal that implementing QoS policies to prioritize business-critical traffic would solve the problem for 20% of the cost. Which department keeps transferring massive files to personal cloud storage accounts? Bandwidth data tells you.
Configuration Tracking
Network devices contain hundreds of settings. Someone changing a single parameter can create security vulnerabilities or break critical services.
Configuration monitoring maintains version history of device configs and flags unauthorized changes. Some solutions can automatically revert modifications that don't match approved baselines.
Compliance frameworks often require configuration auditing. Automated checks can verify that all switches have specific security features enabled or confirm that firewall rules match documented policies.
Security Observation
Network monitoring isn't a replacement for dedicated security tools, but it contributes valuable security insights. Unusual traffic patterns might reveal compromised workstations participating in botnets. Sudden spikes in outbound connections could indicate data theft in progress. Failed login attempts piling up on network gear deserve investigation.
Integration between monitoring platforms and security systems creates richer context for threat detection and incident response.
Key Features of Network Monitoring Applications
Certain capabilities separate professional-grade monitoring platforms from basic utilities.
Contextual Alerting
Notifications should explain not just what failed, but why it matters and what else is affected. Compare these two alerts:
"Router-Core-01 interface GigE0/1 down"
versus
"Router-Core-01 interface GigE0/1 down—47 users in Building C offline since 09:23, preceded by error rate spike starting 09:18"
The second alert gives responders immediate context for prioritizing their response and starting diagnostics.
Consolidated Views
Modern infrastructure spans traditional networks, multiple cloud platforms, wireless systems, and application tiers. Switching between five different monitoring tools to troubleshoot a single issue wastes time and creates blind spots.
Unified dashboards consolidate metrics from all sources. This cross-domain visibility reveals dependencies—slow application performance might trace back to WAN latency three hops away, not the application server everyone's been troubleshooting.
Broad Protocol Coverage
Comprehensive platforms speak every major monitoring protocol: SNMP versions 2c and 3, WMI for Windows, SSH for Linux and Unix systems, APIs for AWS CloudWatch, Azure Monitor, and Google Cloud Operations, plus proprietary protocols for specific vendors.
Limited protocol support creates gaps in your monitoring coverage—you end up with infrastructure nobody's actually watching.
Automatic Discovery
Manually configuring monitoring for 500 devices takes forever and you'll make mistakes. Auto-discovery scans network ranges, identifies what it finds, classifies devices by type, and builds topology maps showing how everything connects.
This becomes crucial during emergencies when you need to quickly understand which other systems depend on the router that just failed.
Growth Architecture
Start-ups might run everything on a single monitoring server. Enterprise deployments require distributed collectors spread across different locations, feeding data to central processors, with load balancing and redundancy built in.
The architecture should scale gracefully—monitoring 50 devices shouldn't require the same infrastructure as monitoring 50,000, but you shouldn't need to rip everything out and start over when you grow.
Integration Options
Monitoring doesn't exist in isolation. Integration with ticketing systems like ServiceNow or Jira automatically creates incident records for critical alerts. Webhooks trigger automation workflows—maybe spinning up additional cloud instances when load spikes. APIs let custom applications query monitoring data or push external metrics into your monitoring platform.
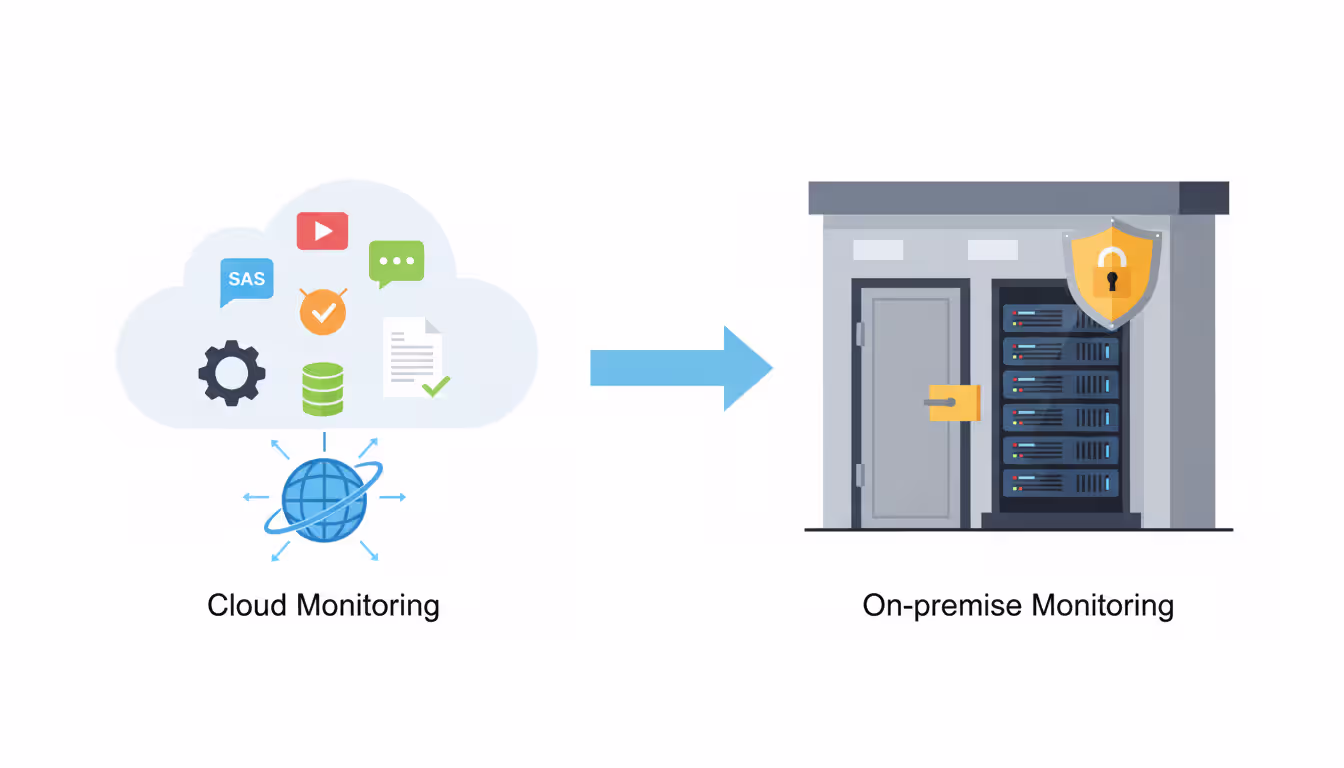
Network Monitoring SaaS vs On-Premise Solutions
Where you run your monitoring infrastructure affects costs, administrative overhead, and operational flexibility for years.
Factor
SaaS
On-Premise
Hybrid
Upfront Investment
Minimal—subscription model
Substantial—licenses plus servers
Varies based on mix
Ongoing Maintenance
Vendor handles updates
Your team manages everything
Split between vendor and internal
Ability to Scale
Grows instantly with demand
Constrained by hardware
Flexible within limits
Configuration Flexibility
Restricted to vendor options
Complete freedom
Depends on components
Data Control
Vendor infrastructure
Your infrastructure
Mixed custody
Time to Deploy
Can start monitoring in days
Requires weeks or months
Several weeks typically
Why Choose Cloud-Based Monitoring
SaaS eliminates infrastructure headaches. No servers to patch, databases to optimize, or storage arrays to expand. Vendors handle maintenance and deploy new features continuously without requiring anything from you.
The multi-tenant economics work in your favor—shared infrastructure costs get distributed across thousands of customers, reducing what you pay per monitored device compared to buying and maintaining dedicated hardware.
Geographic distribution comes standard. Reputable SaaS providers operate from multiple data centers globally, providing built-in redundancy and the ability to monitor your infrastructure from external vantage points—essential for detecting connectivity problems that affect inbound access.
On-Premise Advantages
Regulatory constraints sometimes require keeping monitoring data inside controlled environments. Healthcare organizations dealing with HIPAA regulations or financial institutions under PCI-DSS scrutiny often prefer on-premise deployments for complete data sovereignty.
Air-gapped networks with zero internet connectivity have no choice—manufacturing facilities, critical infrastructure operators, and classified government networks operate in isolation where cloud services can't reach.
Customization reaches maximum depth with on-premise tools. You can modify monitoring logic, integrate with proprietary internal systems, and build completely custom dashboards without vendor limitations or approval.
Author: Chloe Bramwell;
Source: baltazor.com
Financial Considerations
SaaS pricing typically charges per device, per metric, or per data volume ingested. Costs are predictable and ongoing. Monitoring 500 devices might run $3,000-$8,000 monthly depending on how deeply you monitor each one.
On-premise deployments require significant upfront capital—software licenses, server hardware, storage systems—followed by recurring expenses like annual support contracts, staff time for maintenance, and periodic infrastructure refreshes every 3-5 years.
Total cost of ownership calculations must include hidden factors: database administration, backup management, high-availability configurations, and the opportunity cost of your team spending time maintaining monitoring infrastructure instead of monitoring your actual network.
Break-even analysis often favors SaaS for smaller deployments (under 200 devices) while on-premise becomes economical at enterprise scale (thousands of devices), though vendor-specific pricing can shift these numbers significantly.
How to Choose Network Monitoring Tools for Your Business
Selection decisions should align with actual requirements rather than impressive feature lists that sound great in sales presentations but don't match how you'll actually use the product.
Infrastructure Size and Diversity
A 50-person office with basic internet connectivity needs different capabilities than a multi-site enterprise running MPLS networks, SD-WAN, hybrid cloud workloads, and supporting remote workers globally.
Device count matters, but so does variety. Monitoring 500 identical Cisco switches is simpler than monitoring 200 heterogeneous devices from six different vendors spanning three technology generations.
Team Skill Sets
Sophisticated platforms offer tremendous power but demand expertise to configure properly and maintain over time. If your team consists of generalist IT staff rather than dedicated network engineers, intuitive interfaces and strong vendor support become critical selection factors.
Some tools provide extensive customization through Python scripting and REST APIs—incredibly valuable if you have developers available, completely wasted if you don't.
Financial Constraints
Look beyond software costs to implementation services, training programs, and ongoing administration requirements. That "free" open-source solution might consume more staff time than a commercial product with straightforward setup wizards.
Calculate total cost across three years rather than focusing only on year one. Subscription models spread expenses evenly; perpetual licenses concentrate costs upfront but might offer better long-term economics for stable deployments.
Must-Have Requirements
Create your list of absolute requirements before talking to vendors. Examples might include: must support Cisco Meraki cloud APIs, must integrate with Slack for team notifications, must poll devices at sub-minute intervals, must meet FedRAMP compliance standards for government cloud deployments.
Common mistakes include choosing based on flashy demos showcasing features you'll never actually use while missing critical capabilities your specific environment requires.
Vendor Viability
Monitoring tools become deeply embedded in daily operations. Vendor longevity, financial stability, and product roadmap commitment matter significantly. That innovative start-up offering cutting-edge features might get acquired next year with the product discontinued six months later.
Support quality varies dramatically between vendors. Check contractual response time commitments, whether support costs extra or comes included, and most importantly whether you reach knowledgeable engineers or tier-one support reading from scripts.
Hands-On Testing
Most vendors offer trial periods or proof-of-concept deployments. Test in your actual production environment, not sanitized lab setups. Verify that discovery works with your specific device mix, confirm integrations function as documented, and validate that alert accuracy meets your needs.
Get feedback from the people who will actually use this tool every day. Their hands-on experience reveals usability problems that never surface in vendor demonstrations.
Common Network Monitoring Alerts and How to Configure Them
Author: Chloe Bramwell;
Source: baltazor.com
Alert configuration separates useful monitoring from notification spam that everyone learns to ignore.
Interface State Changes
Network interfaces going down require immediate notification—unless they're flapping briefly during maintenance, shutting down for scheduled backups, or redundant links switching over during normal failover tests.
Configuration recommendations: Require interfaces to stay down for at least two consecutive polls before alerting (prevents brief flap notifications). Suppress alerts during documented maintenance windows. Assign different severity levels—critical for uplinks carrying production traffic, warning for redundant connections.
Capacity Thresholds
Bandwidth alerts warn when links approach saturation. Setting useful thresholds requires understanding normal patterns for each circuit. Triggering at 70% utilization makes sense for a link that normally runs at 30%, but would create constant noise on a circuit averaging 60%.
Time-aware thresholds adjust based on learned patterns. The system recognizes that 75% utilization at 10 AM Tuesday is perfectly normal but the same number at midnight Sunday warrants investigation.
Configure tiered alerts: warnings at 70% utilization and critical notifications at 85%. This provides advance warning before performance actually degrades.
Error Rate Spikes
Network interfaces track various error types—CRC errors, collisions, dropped packets. Background noise is normal; a few CRC errors per billion packets doesn't indicate problems. Alerts should trigger on sudden changes rather than absolute counts.
Effective configuration: Alert when error rate exceeds 0.1% of total packets AND errors increased by 500% compared to the previous hour. This catches genuine problems while ignoring statistical noise.
System Health Indicators
CPU and memory alerts prevent performance degradation before it impacts users. Network equipment typically runs efficiently up to 70-80% CPU utilization, but sustained periods above 90% signal problems requiring attention.
Temperature monitoring protects against cooling failures. Most gear operates safely up to 40-45°C but should trigger warnings at 50°C and critical alerts at 60°C before damage occurs.
Latency and Loss
Application performance correlates directly with network latency and packet loss. Voice and video become unusable above 150ms latency or 1% packet loss. Configure graduated alerts: warning level at 100ms/0.5% loss, critical level at 150ms/1% loss.
Measure latency between endpoints that matter for your business—branch offices to data centers, remote sites to cloud applications—not just from your monitoring server to random internet destinations.
Security Indicators
Failed authentication attempts, particularly multiple failures from the same source address, might indicate brute-force attacks underway. Configuration changes outside scheduled maintenance windows deserve review—someone might be making unauthorized modifications. Unusual traffic patterns like a workstation suddenly initiating thousands of outbound connections warrant immediate investigation.
Correlate network monitoring alerts with security tool data for richer context. DNS queries to suspicious domains combined with increased outbound traffic suggests compromised systems.
Notification Delivery and Escalation
Email works for low-priority informational alerts reviewed periodically. SMS or mobile push notifications suit urgent issues requiring prompt response. Actual phone calls (yes, voice calls) should be reserved for critical emergencies affecting major business services.
Escalation logic routes alerts based on severity and timing. During business hours, warnings might go to a shared IT queue. After hours, critical alerts page the on-call engineer immediately, escalating to their manager if unacknowledged within fifteen minutes.
Combating Alert Fatigue
Too many alerts train people to ignore all of them. Review alert frequency monthly and adjust thresholds. If an alert fires multiple times daily without ever requiring action, either the threshold needs adjustment or you need to fix the underlying condition permanently.
Group related alerts intelligently. When a core switch fails, dozens of dependent devices become unreachable. Smart monitoring recognizes topology relationships and sends one notification about the root cause rather than flooding administrators with alerts about every affected device.
Acknowledgment features let administrators indicate they're working on an issue, suppressing repeat notifications without completely disabling the alert.
We used to learn about network problems when users flooded the help desk with complaints. Now monitoring alerts us to degrading performance before users notice anything wrong. Shifting from reactive firefighting to proactive management has completely transformed both our operations team's effectiveness and the service quality we deliver
— Jennifer Martinez
FAQ
What are network monitoring tools used for?
These tools track whether your routers, switches, firewalls, servers, and network connections are working properly. They watch for outages, spot performance problems before users complain, show you which applications consume bandwidth, send alerts when things break, and collect data that helps you plan infrastructure upgrades. Basically, they prevent you from being blindsided by network problems and give you the information needed to keep everything running smoothly.
How much do network monitoring tools cost?
Prices vary wildly depending on what you're monitoring and how you deploy it. Cloud-based services typically charge $5-$30 monthly per device—enterprise contracts with thousands of devices get negotiated separately. Self-hosted software ranges from free open-source options to $50,000+ for enterprise licenses. Don't forget implementation costs, annual support contracts, and infrastructure expenses. Small business deployments might start around $500-$1,000 yearly while large enterprise monitoring can exceed $100,000 annually.
What's the difference between network monitoring and network security?
Network monitoring focuses on keeping things running well—tracking availability, performance, and operational health. Network security concentrates on protecting against attacks, unauthorized access, and data breaches. They overlap significantly though. Monitoring tools often spot unusual traffic patterns indicating security problems, while security tools monitor network activity for threats. You really need both working together for complete visibility.
Can small businesses benefit from network monitoring tools?
Definitely. Small businesses often lack backup systems, making any downtime especially painful. Monitoring provides early warning before minor issues become major disasters, helps you make smart decisions about where to spend limited IT budgets, and documents what's actually happening on your network for troubleshooting. Cloud-based monitoring brings enterprise capabilities to small-business budgets with minimal technical complexity. Even basic monitoring beats waiting for angry users to report that everything's broken.
How often should network monitoring alerts be reviewed?
Critical alerts demand immediate attention—that's their entire purpose. Warning-level notifications should get reviewed within business hours, typically 1-4 hours depending on severity. Informational alerts can wait for regular maintenance windows or weekly review sessions. Beyond responding to individual alerts, conduct monthly pattern reviews to identify recurring problems needing permanent fixes and adjust thresholds creating excessive false alarms. Quarterly reviews should evaluate whether your alert strategy still matches business priorities.
What protocols do network monitoring tools support?
Most platforms support SNMP (versions 1, 2c, and 3) as the foundation for device monitoring. Additional common protocols include ICMP for basic reachability tests, WMI for gathering data from Windows systems, SSH for Linux and Unix servers, and Syslog for centralized log collection. Modern tools add NetFlow, sFlow, or IPFIX for traffic analysis, REST APIs for cloud platforms and software-defined infrastructure, and streaming telemetry protocols like gRPC for collecting high-frequency data from next-generation equipment.
Network monitoring has transformed from optional IT overhead into a business necessity. Modern infrastructure complexity—traditional networks, cloud platforms, remote workers, IoT devices—makes manual oversight impossible. Organizations implementing comprehensive monitoring catch problems faster, fix issues more efficiently, and make infrastructure decisions based on data rather than guesswork.
Your ideal monitoring approach depends on your specific environment, available resources, and actual requirements. Small businesses often thrive with straightforward cloud-based solutions delivering essential visibility without administrative burden. Enterprises frequently need sophisticated self-hosted platforms offering deep customization and integration with existing management infrastructure. Many organizations discover hybrid approaches work best—cloud monitoring for external services combined with on-premise monitoring for internal infrastructure.
Success extends beyond just deploying software. Effective monitoring requires thoughtful alert configuration that notifies appropriate people about genuine problems without creating noise. Regular review and adjustment keeps pace as your network evolves. Most critically, you must act on monitoring insights—fixing recurring issues, upgrading overloaded circuits, addressing security concerns before they escalate into breaches.
Investment in monitoring tools delivers returns through reduced downtime, improved user satisfaction, and operational efficiency. Networks will only grow more complex—monitoring evolves from valuable to absolutely essential for maintaining reliable, secure, performant infrastructure supporting organizational goals.
When you print thousands of product labels or engrave a QR code onto a memorial plaque, that code must work indefinitely. Learn which QR code types never expire, how to generate permanent codes, and mistakes that can make even 'permanent' codes fail
Organizations lose $5,600 per minute during network downtime. A network traffic monitor provides visibility into data flows, enabling IT teams to maintain performance, troubleshoot issues, and detect threats before escalation. This guide covers implementation, tool selection, and best practices
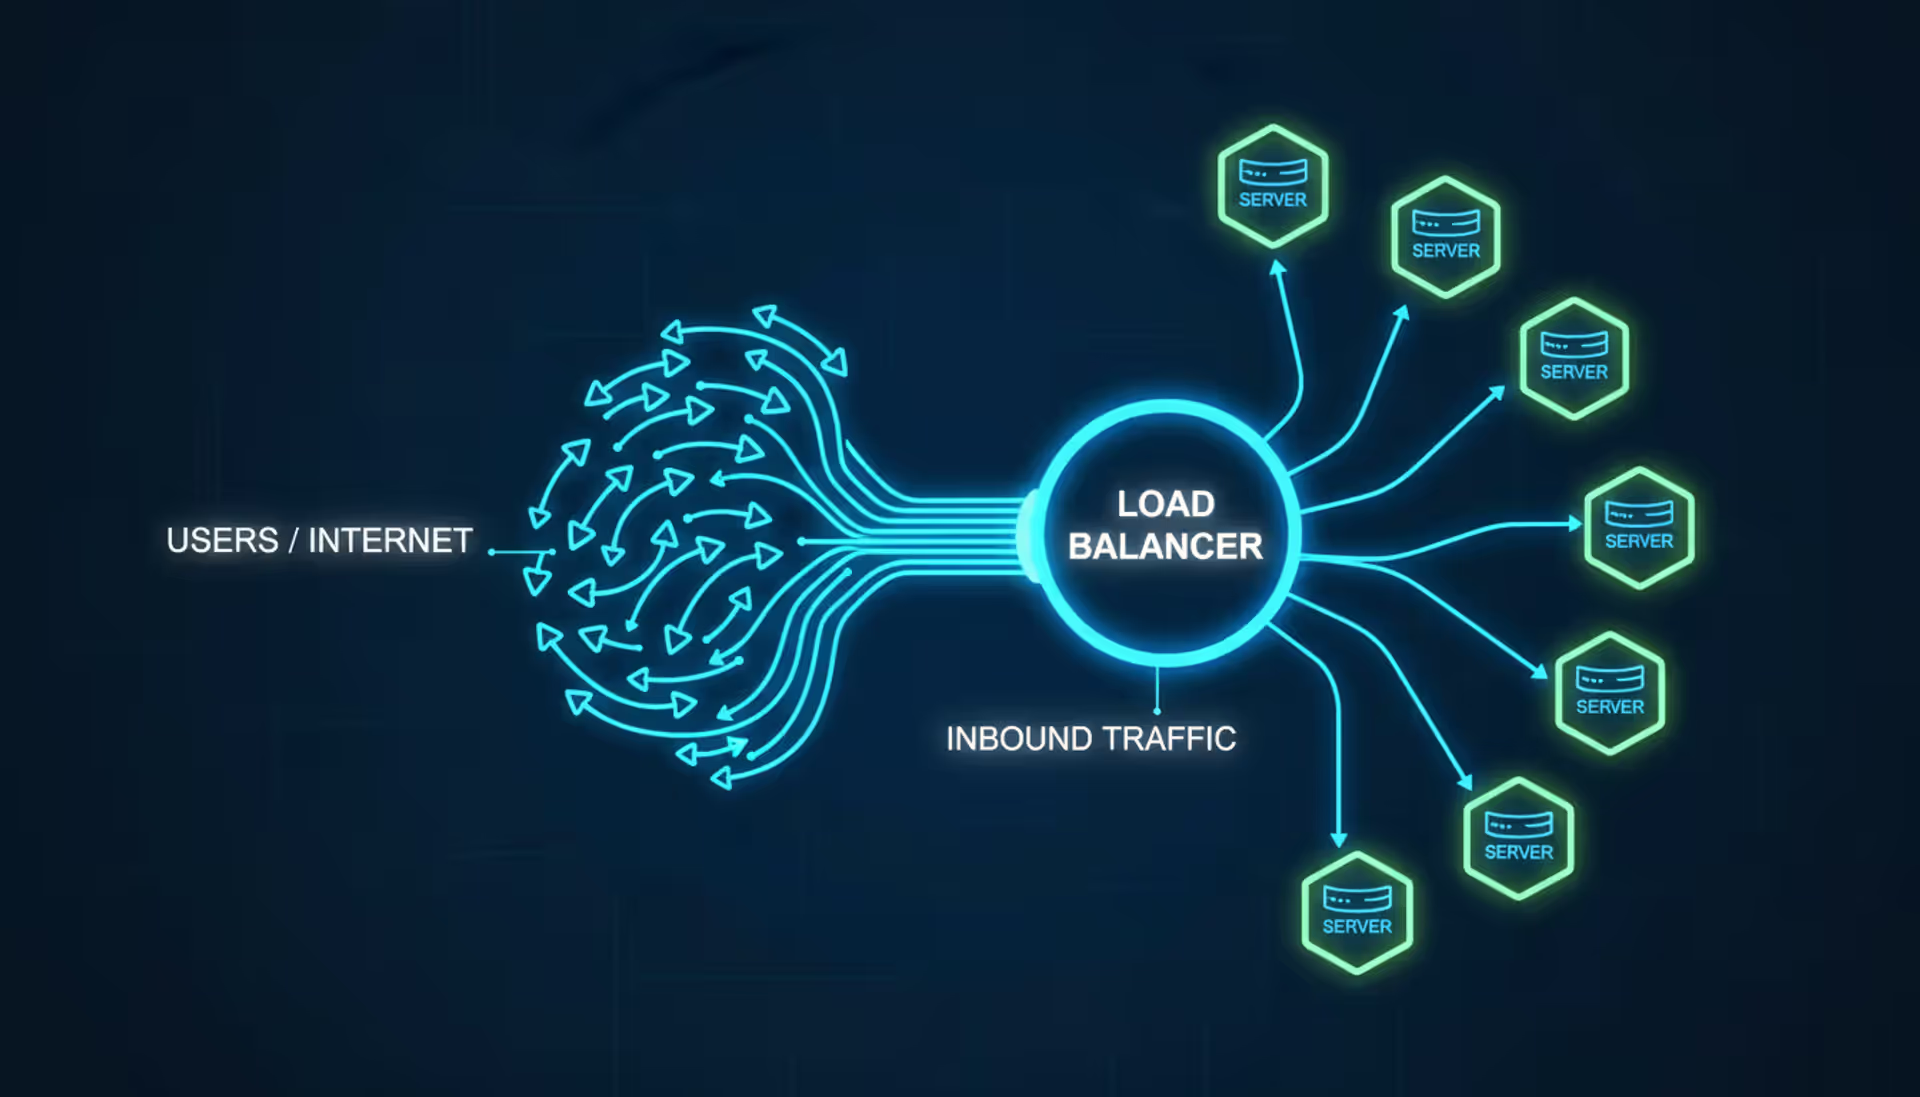
Load balancers distribute network traffic across multiple servers to prevent overload and ensure high availability. This guide covers load balancer architecture, algorithms, DNS-based methods, cloud services vs on-premises solutions, and implementation best practices for modern infrastructure
Deploying connected devices across states or countries requires more than a standard cellular plan. An internet of things sim card provides specialized connectivity for sensors, trackers, and industrial equipment—often for years without manual intervention
The content on this website is provided for general informational and educational purposes only. It is intended to explain concepts related to cloud computing, computer networking, infrastructure, and modern IT systems.
All information on this website, including articles, guides, and examples, is presented for general educational purposes. Technology implementations may vary depending on specific environments, business needs, infrastructure design, and technical requirements.
This website does not provide professional IT, engineering, or technical advice, and the information presented should not be used as a substitute for consultation with qualified IT professionals.
The website and its authors are not responsible for any errors or omissions, or for any outcomes resulting from decisions made based on the information provided on this website.