Network administrators who rely on daily reports or hourly snapshots discover problems only after users complain. A real time network traffic monitor changes that dynamic by showing what's happening on your network at this exact moment—every packet, every connection, every anomaly as it occurs.
What Is a Real Time Network Traffic Monitor
A real time network traffic monitor is a system that captures, analyzes, and displays network data continuously with minimal latency—typically within seconds of an event occurring. Unlike tools that collect data in batches or generate periodic reports, these monitors provide instant visibility into bandwidth consumption, active connections, protocol distribution, and traffic patterns across your infrastructure.
The "real time" designation matters. Traditional monitoring solutions might poll devices every five minutes or aggregate logs hourly. During those gaps, a DDoS attack could flood your servers, a misconfigured application could saturate your WAN link, or a compromised endpoint could exfiltrate gigabytes of sensitive data. Real time monitoring eliminates these blind spots by processing network telemetry as it happens, not after the fact.
These systems distinguish themselves through three core characteristics: continuous data capture without sampling gaps, sub-minute alert generation when thresholds are breached, and live dashboards that refresh automatically without manual intervention. A network engineer troubleshooting a slowdown can watch traffic flows shift in real time as they make configuration changes, rather than waiting for the next report cycle to confirm whether their fix worked.
How Real Time Network Monitoring Works
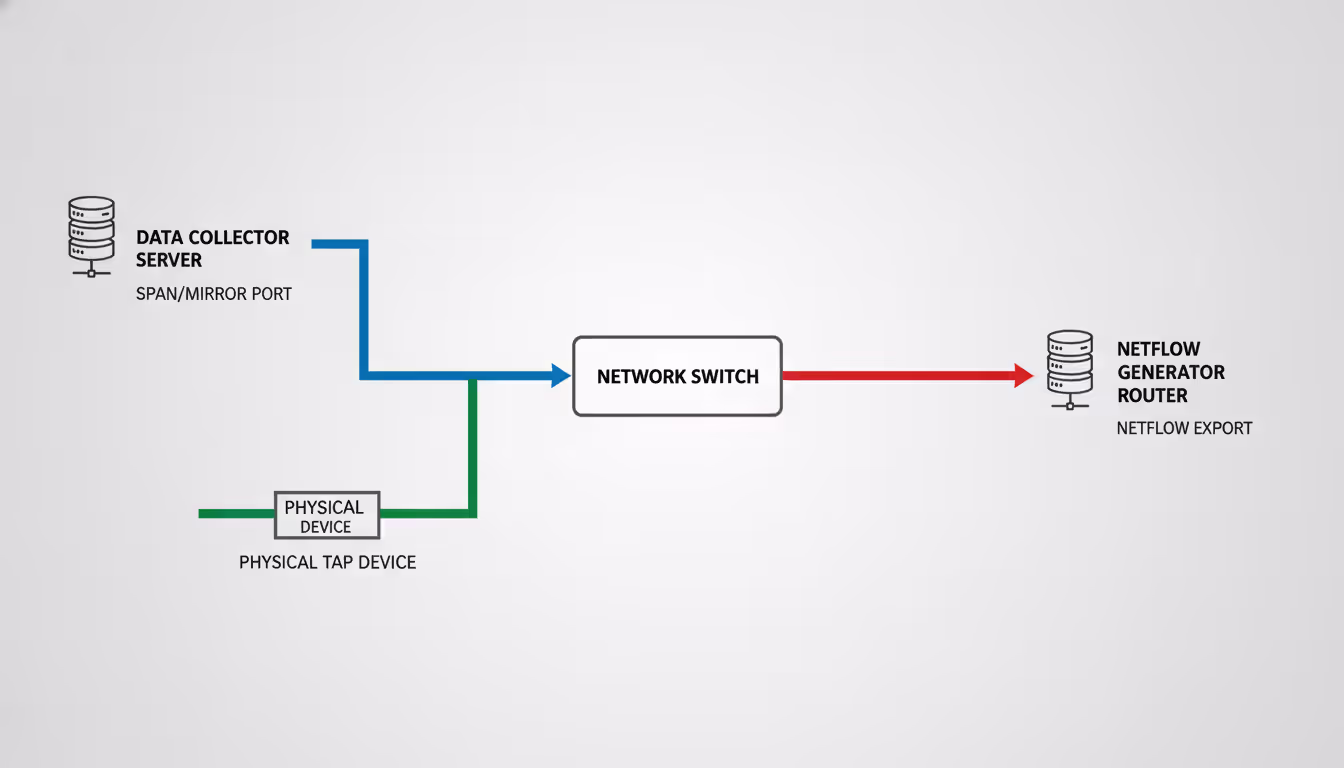
Real time monitoring systems intercept or receive copies of network traffic through several technical approaches. The most common method uses SPAN (Switched Port Analyzer) or mirror ports on switches, which duplicate traffic from monitored ports to a collection interface. Network TAPs (Test Access Points) provide another option—physical devices inserted into network links that split the optical or electrical signal, sending one copy to monitoring tools without introducing latency or failure points.
Flow-based protocols like NetFlow, sFlow, and IPFIX offer a lighter-weight alternative. Instead of capturing full packet payloads, network devices generate metadata records describing each conversation: source and destination addresses, ports, protocols, byte counts, and timestamps. These flow records consume far less bandwidth and storage than full packet capture while still providing comprehensive visibility into traffic patterns.
Modern real time monitoring systems also leverage SNMP (Simple Network Management Protocol) to poll device statistics, API integrations with cloud platforms, and agent-based collection from endpoints. The key differentiator is the processing pipeline—data streams into collectors, gets analyzed by correlation engines that apply filters and detection rules, then feeds dashboards and alerting systems within seconds of capture.
Author: Megan Holloway;
Source: baltazor.com
Key Components of a Monitoring System
Every real time network traffic monitor includes several essential building blocks. Collectors or sensors sit at strategic network points, gathering traffic data through the methods described above. These might be dedicated hardware appliances, virtual machines running on your hypervisor, or cloud-based receivers for SaaS deployments.
The analysis engine processes incoming data streams, applying protocol decoders, traffic classification algorithms, and behavioral baselines. This component identifies what applications are running, which users are consuming bandwidth, and whether traffic patterns match expected norms. Advanced systems incorporate machine learning models that adapt baselines automatically as your network evolves.
Storage systems buffer recent traffic data for forensic analysis and historical comparison. While real time monitoring focuses on current conditions, the ability to replay the past hour or day proves invaluable during incident response. Most platforms use time-series databases optimized for high-volume metric ingestion and rapid query response.
The presentation layer—dashboards, reports, and alerting interfaces—translates raw metrics into actionable intelligence. Network operations teams need to spot problems quickly, so effective visualization matters. Heat maps showing bandwidth by subnet, top-talker lists ranking the heaviest users, and protocol distribution charts all help administrators understand network behavior at a glance.
Data Collection and Analysis Process
The journey from packet to insight follows a consistent pattern. When a user downloads a file, that traffic passes through your network infrastructure. If you've configured a mirror port on the distribution switch, a copy of every packet in that session flows to your monitoring collector. The collector timestamps each packet upon arrival—this timestamp anchors the "real time" nature of the system.
Protocol analyzers within the collector decode packet headers, identifying this as an HTTPS connection to a cloud storage service. The system extracts metadata: client IP, server IP, port numbers, TLS version, certificate details, and payload size. This metadata gets tagged with context from your configuration—perhaps the client IP belongs to the engineering VLAN, and the destination matches a known file-sharing service.
The analysis engine compares this session against multiple criteria simultaneously. Does the bandwidth consumption exceed per-user policies? Is this destination on an approved application list? Does the traffic volume or timing match the user's historical pattern? If any rule triggers, the system generates an alert and updates relevant dashboard widgets—all within the time it takes the user to download a few megabytes.
Flow-based monitoring follows a similar path but starts with summarized records rather than raw packets. A router configured for NetFlow exports a record every time a connection closes or after a timeout period. These records arrive at the collector in batches every few seconds, get correlated with existing sessions, and feed the same analysis and visualization pipeline.
Why Organizations Need Real Time Traffic Monitoring
Author: Megan Holloway;
Source: baltazor.com
Security teams face adversaries who move quickly. Ransomware operators often complete their encryption runs within hours of initial compromise. Data exfiltration happens in compressed bursts designed to avoid detection. Real time monitoring provides the visibility needed to spot these attacks while defenders still have time to respond. When a server suddenly initiates thousands of outbound connections or begins uploading data to an unfamiliar destination at 3 AM, immediate alerts let security analysts investigate and contain the threat before major damage occurs.
Performance optimization depends on understanding how applications actually behave on your network. A video conferencing system might work perfectly during testing but struggle when fifty employees join calls simultaneously. Real time bandwidth monitoring shows exactly which links saturate during peak usage, which quality-of-service policies are effective, and whether your ISP is delivering promised throughput. Network teams can adjust routing, implement traffic shaping, or justify infrastructure upgrades with concrete data rather than user complaints.
Capacity planning traditionally relied on monthly averages and growth projections. That approach misses important details. Your average utilization might be 40%, but if you hit 95% saturation every Tuesday during backup windows, users experience slowdowns regardless of overall capacity. Real time monitoring systems track peak utilization patterns, identify growth trends in specific application categories, and help you invest in upgrades before problems become critical.
Troubleshooting network issues without real time visibility means guessing. Did the application timeout because of network latency, server overload, or a misconfigured firewall rule? Real time data monitoring lets you eliminate possibilities quickly. You can watch traffic flows in real time as you test changes, correlate application performance metrics with network conditions, and identify the actual bottleneck rather than chasing symptoms.
The difference between real time monitoring and traditional approaches is like comparing a live video feed to a photo album. When a critical application starts degrading, we need to see what's happening right now—not a snapshot from five minutes ago. Real time visibility has cut our mean time to resolution by more than 60% because we're responding to actual conditions instead of stale data
— James Morrison
Choosing the Right Network Traffic Monitor for Your Needs
Network size fundamentally shapes your monitoring requirements. A small office with fifty users and a single internet connection needs different capabilities than a distributed enterprise with thousands of endpoints across multiple data centers. Small deployments can often leverage all-in-one appliances or lightweight software tools that monitor a few interfaces. Large environments require distributed collection architectures with centralized management, hierarchical data aggregation, and scalable storage backends.
Budget constraints force trade-offs between features, capacity, and deployment models. Enterprise-grade monitoring platforms with advanced analytics, unlimited retention, and 24/7 vendor support command premium pricing—often tens of thousands of dollars annually. Open-source alternatives like ntopng or Elastic Stack components provide powerful capabilities at the cost of internal expertise and management overhead. Cloud-based monitoring services offer predictable per-device or per-gigabyte pricing that scales with your infrastructure.
Feature requirements vary by use case. Security-focused organizations prioritize deep packet inspection, threat intelligence integration, and anomaly detection. Performance-focused teams need application-layer visibility, transaction tracing, and user experience metrics. Capacity planning emphasizes long-term trend analysis and forecasting tools. Most organizations need elements of all three, so identifying your primary use case helps prioritize features when evaluating products.
Deployment flexibility matters more as networks become hybrid. A real time monitoring system that only works with on-premise infrastructure creates blind spots if you're migrating workloads to AWS or Azure. Look for platforms that can monitor physical networks, virtual environments, cloud VPCs, and SaaS applications through a unified interface. Agent-based collection extends visibility to encrypted traffic and application metrics that packet capture alone cannot provide.
Scalability determines whether a solution will serve you for years or require replacement as you grow. Can the platform handle 10x your current traffic volume? Does licensing allow adding more sensors without renegotiating contracts? Will performance degrade gracefully under load, or does the system collapse when traffic spikes? Test these limits during evaluation—vendors rarely volunteer their breaking points.
Integration capabilities extend the value of monitoring data. A real time bandwidth monitor that feeds alerts into your SIEM platform, creates tickets in your ITSM system, and triggers automation workflows becomes part of your operational fabric. Standalone tools that require separate logins and manual data export remain isolated, limiting their impact on your security and operations processes.
Common Implementation Mistakes to Avoid
Deploying monitoring sensors without establishing baseline behavior creates alert chaos. Every network has unique patterns—backup windows, batch processing jobs, legitimate high-bandwidth applications. If you enable alerting immediately after installation with default thresholds, you'll generate hundreds of false positives. Spend at least a week in observation mode, let the system learn normal behavior, then tune thresholds based on actual traffic patterns before enabling automated alerts.
Alert fatigue undermines monitoring effectiveness faster than any technical limitation. When your real time monitoring system generates fifty alerts daily, administrators start ignoring them. Be ruthless about alert tuning. Each alert should represent a genuine problem requiring human attention. If an alert fires routinely without consequence, either raise the threshold, adjust the detection logic, or disable it entirely. The goal is a signal-to-noise ratio where every alert matters.
Sensor placement determines what you can see. Monitoring only your internet gateway misses internal lateral movement, server-to-server traffic, and problems within your data center. Monitoring only access switches misses aggregated patterns visible at the distribution layer. A comprehensive real time monitoring system requires strategic sensor placement at network boundaries, aggregation points, and critical infrastructure segments. Map your network topology, identify choke points and security boundaries, then position collectors accordingly.
Lack of integration with existing tools creates information silos. Your real time network traffic monitor might detect a bandwidth spike, but without context from your configuration management database, you won't know which application or business unit is affected. Without integration to your ticketing system, alerts become emails that get lost. Without SIEM integration, network anomalies remain disconnected from security events. Plan integration points during initial deployment, not as an afterthought.
Insufficient retention policies limit forensic capabilities. Real time monitoring focuses on current conditions, but investigations often require historical context. That suspicious traffic pattern you noticed today might connect to events from last week. Balance storage costs against investigative needs—many organizations retain high-resolution data for 7-30 days, then downsample to hourly or daily summaries for longer-term storage.
Author: Megan Holloway;
Source: baltazor.com
Real Time Monitoring vs. Traditional Network Analysis
Traditional network analysis relies on periodic data collection, batch processing, and scheduled reporting. SNMP polls every five minutes, flow records aggregate into hourly summaries, and reports generate overnight. This approach worked when networks changed slowly and problems developed gradually. The processing overhead is lower, storage requirements are modest, and the tools are mature and stable.
Real time monitoring demands continuous processing, immediate analysis, and instant alerting. Every packet or flow record gets analyzed as it arrives. Dashboards update constantly. Alerts fire within seconds of threshold breaches. This approach requires more computational resources, generates more data, and introduces complexity. The payoff is immediate visibility and rapid response capabilities.
Neither approach is universally superior—the right choice depends on your requirements. Security operations centers monitoring for active threats need real time visibility. An attacker exploiting a vulnerability won't wait for your next report cycle. Capacity planning for next quarter's budget can rely on weekly trend reports without real time granularity. Financial constraints might limit real time monitoring to critical infrastructure while using traditional methods for less sensitive segments.
Hybrid strategies combine both approaches effectively. Deploy real time monitoring at security boundaries, critical application tiers, and high-value assets where immediate detection matters. Use traditional periodic collection for stable infrastructure segments where historical trends suffice. This tiered approach balances cost, complexity, and visibility based on actual risk and operational requirements.
The monitoring landscape in 2026 increasingly favors real time approaches as infrastructure costs decline and threats accelerate. Cloud-based monitoring platforms offer real time capabilities at price points that were unthinkable five years ago. Open-source tools have matured to enterprise-grade reliability. The question is no longer whether to implement real time monitoring, but how much of your infrastructure warrants that level of visibility.
Feature
On-Premise
Cloud-Based
Hybrid
Initial Cost
High (hardware, licenses)
Low (subscription only)
Medium (partial hardware)
Ongoing Cost
Moderate (maintenance, power)
Predictable (monthly/annual)
Variable (mixed model)
Scalability
Limited by hardware capacity
Elastic, scales with usage
Flexible, scales selectively
Maintenance
Internal team responsibility
Vendor managed
Shared responsibility
Data Control
Complete on-premise retention
Data stored in vendor cloud
Sensitive data on-premise
Deployment Speed
Weeks to months
Hours to days
Days to weeks
Customization
Highly customizable
Limited to vendor features
Customizable on-premise components
Best For
Regulated industries, large enterprises
Small to mid-size, cloud-native orgs
Distributed enterprises, hybrid infrastructure
FAQ: Real Time Network Traffic Monitoring
How much does a real time network traffic monitor cost?
Pricing varies dramatically based on network size, features, and deployment model. Small business solutions monitoring a single site with under 100 devices start around $1,000-3,000 annually for cloud-based services or $5,000-10,000 for on-premise appliances. Enterprise platforms monitoring thousands of devices across multiple locations range from $50,000 to several hundred thousand dollars annually. Open-source solutions eliminate licensing costs but require internal expertise—budget for staff time, servers, and storage infrastructure. Most vendors price per sensor, per device monitored, or per gigabyte of traffic analyzed.
Can small businesses benefit from real time network monitoring?
Absolutely. Small businesses face the same security threats as enterprises but typically have fewer IT resources to respond. Real time monitoring provides early warning of ransomware infections, unauthorized access attempts, and bandwidth abuse before they escalate into major incidents. Cloud-based monitoring services designed for small businesses offer enterprise-grade capabilities at accessible price points—often $100-500 monthly for basic coverage. The return on investment comes from preventing a single major outage or security breach that could cost thousands in lost productivity and remediation.
What's the difference between bandwidth monitoring and traffic monitoring?
Bandwidth monitoring tracks how much network capacity you're consuming—the volume of data flowing through links over time. It answers questions like "Is my internet connection saturated?" or "Which department uses the most bandwidth?" Traffic monitoring goes deeper, analyzing what types of traffic are consuming that bandwidth, which applications and protocols are active, who's communicating with whom, and whether traffic patterns match expected behavior. A real time bandwidth monitor might show 80% utilization, while traffic monitoring reveals that 60% is BitTorrent traffic violating your acceptable use policy. Most modern real time monitoring systems include both capabilities.
How long does it take to deploy a real time monitoring system?
Cloud-based solutions can be operational within hours—create an account, install agents or configure flow exports from your network devices, and start receiving data. On-premise deployments take longer: one to two weeks for small environments, four to eight weeks for enterprise implementations. The timeline includes hardware procurement, software installation, sensor placement, network configuration changes to enable monitoring ports or flow exports, baseline establishment, and alert tuning. Complex environments with custom integrations, extensive policy configuration, or compliance requirements might extend deployment to several months. The actual technical installation is quick; tuning the system to your environment takes time.
Do I need dedicated staff to manage network traffic monitoring?
Not necessarily. Cloud-based monitoring platforms with managed services handle much of the operational burden—the vendor maintains the infrastructure, updates the software, and sometimes provides alert triage services. Small to mid-size organizations often assign monitoring responsibilities to existing network or security staff as part of their broader duties. Large enterprises typically have dedicated network operations center teams that monitor dashboards continuously. The staffing requirement depends on your environment's complexity, your response time requirements, and whether you're using monitoring for security, performance, or both. Plan for at least a few hours weekly to review dashboards, tune alerts, and investigate anomalies.
Does real time monitoring slow down network performance?
Properly implemented real time monitoring has negligible impact on network performance. SPAN ports and network TAPs copy traffic passively without introducing latency to production flows. Flow-based monitoring generates small metadata records—typically less than 1% of total bandwidth. Agent-based monitoring consumes minimal CPU and memory on endpoints. The monitoring infrastructure itself—collectors, analyzers, storage—operates on dedicated hardware or virtual machines separate from production traffic. Poor implementations can cause problems: overloading a switch with too many SPAN sessions, misconfiguring flow exports to overwhelm a collector, or running resource-intensive analysis on production servers. Follow vendor best practices for sensor placement and capacity planning to avoid performance impacts.
A real time network traffic monitor transforms network management from reactive firefighting to proactive operations. The ability to see what's happening right now—not what happened five minutes ago—enables faster troubleshooting, earlier threat detection, and more confident decision-making about infrastructure changes.
Start small if you're new to real time monitoring. Deploy sensors at your internet gateway and most critical application servers. Establish baselines, tune alerts, and build confidence with the technology before expanding coverage. Many organizations discover that monitoring their most visible 20% of infrastructure provides 80% of the operational value.
Choose solutions that align with your team's skills and your organization's trajectory. A cloud-native startup should probably avoid complex on-premise monitoring platforms. A healthcare provider with strict data residency requirements needs on-premise or hybrid options. Your network will evolve—ensure your monitoring system can evolve with it.
The investment in real time monitoring pays dividends beyond incident response. The data you collect informs capacity planning, validates application performance claims, supports security compliance requirements, and provides objective evidence during vendor disputes about service quality. Network visibility isn't overhead—it's operational intelligence that makes everything else work better.
Virtual desktop infrastructure represents a fundamental shift in how organizations deliver computing resources. Learn about VDI architecture, deployment models (on-premises, cloud, hybrid), implementation costs, use cases, and how to select the right solution for remote work and centralized management needs
Public cloud storage has become the backbone of modern data infrastructure, powering everything from smartphone photo backups to enterprise disaster recovery systems. Learn how it works, key benefits and limitations, security considerations, and how to choose the right provider for your needs
Choosing between on-premise and cloud infrastructure affects budget, security, compliance, and agility. Understand cost structures, security trade-offs, and migration planning to make informed decisions aligned with your business requirements and strategic goals
OAuth 2.0 enables secure API access through token-based authorization. This guide explains how OAuth 2.0 works, authorization flows, grant types, and key differences from OpenID Connect to help developers implement secure authentication systems
The content on this website is provided for general informational and educational purposes only. It is intended to explain concepts related to cloud computing, computer networking, infrastructure, and modern IT systems.
All information on this website, including articles, guides, and examples, is presented for general educational purposes. Technology implementations may vary depending on specific environments, business needs, infrastructure design, and technical requirements.
This website does not provide professional IT, engineering, or technical advice, and the information presented should not be used as a substitute for consultation with qualified IT professionals.
The website and its authors are not responsible for any errors or omissions, or for any outcomes resulting from decisions made based on the information provided on this website.