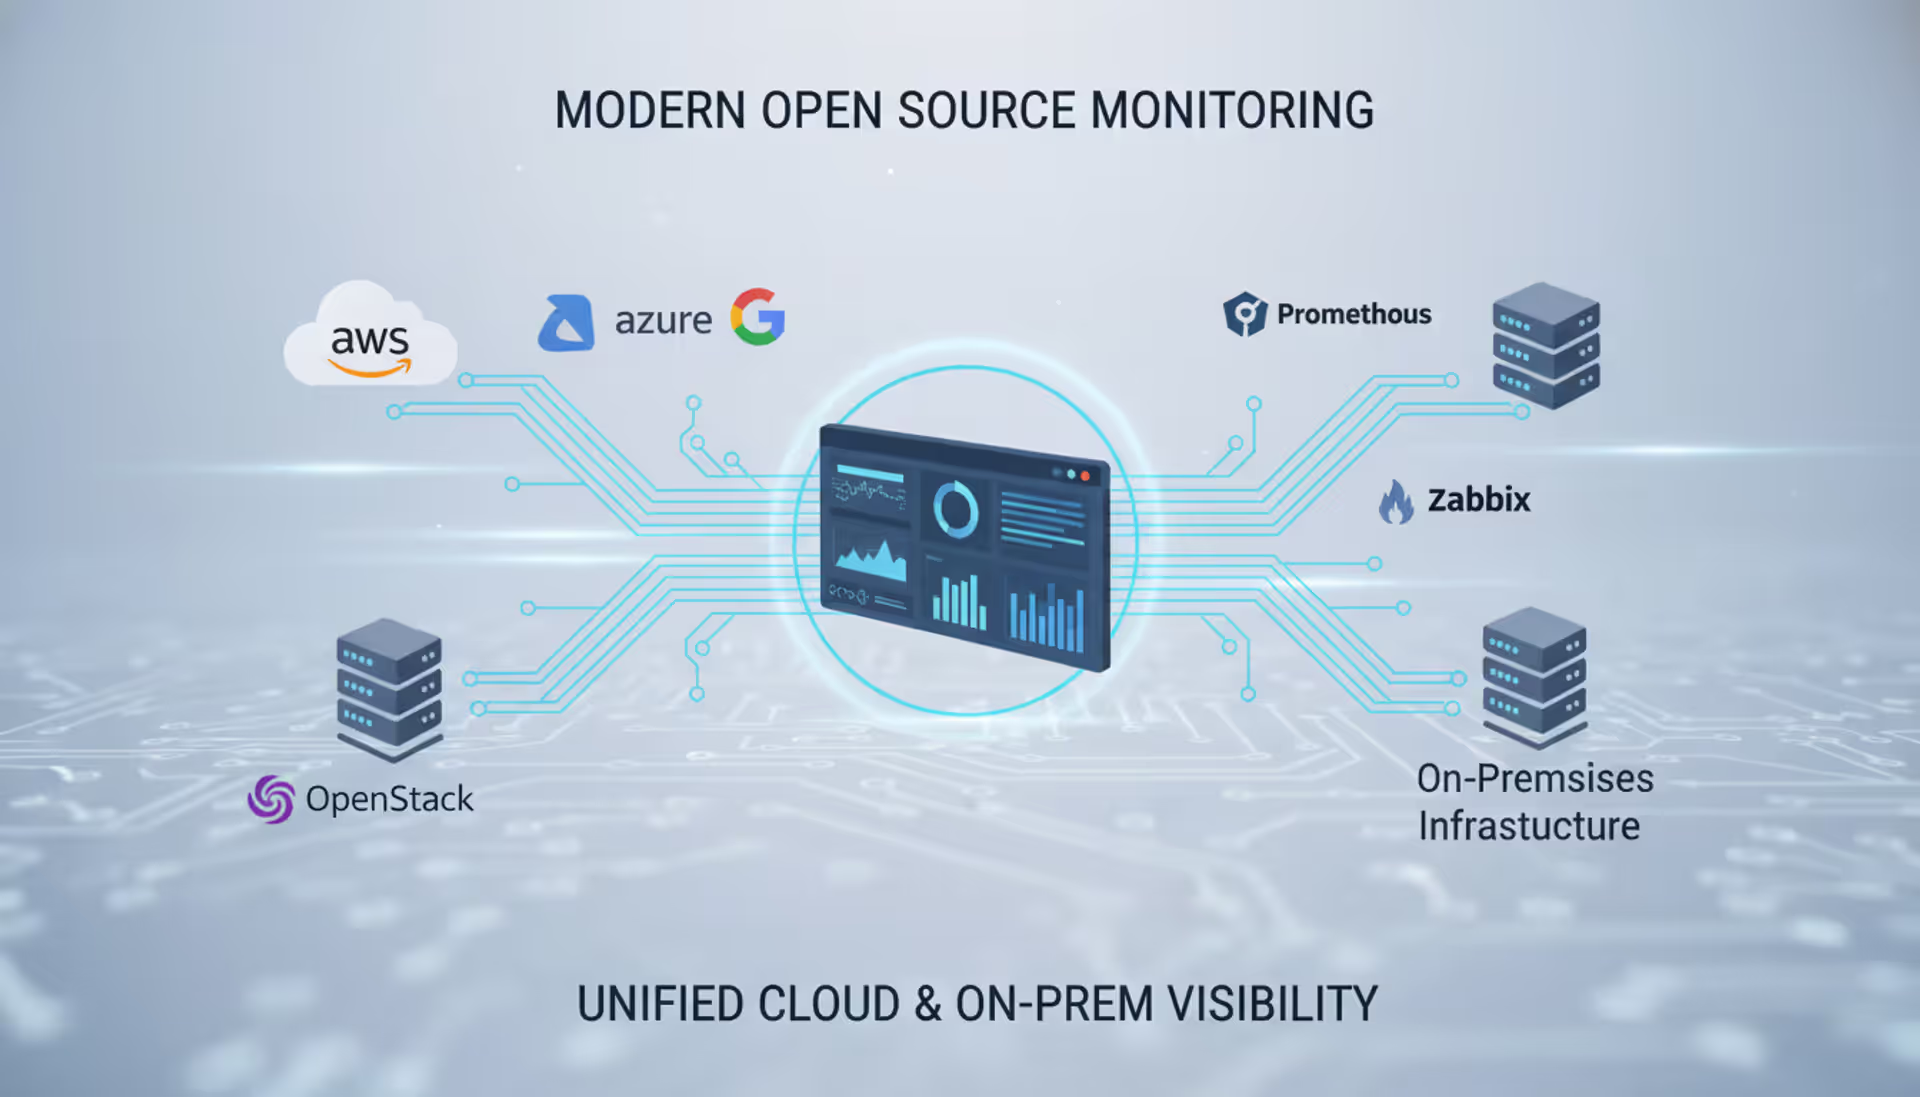
Network infrastructure failures cost enterprises an average of $9,000 per minute in 2026. Organizations running distributed systems, cloud workloads, and hybrid environments need constant visibility into their network health. Open source network monitoring delivers this visibility without the licensing fees, vendor restrictions, or black-box limitations of proprietary platforms.
What Is Open Source Network Monitoring
Open source network monitoring refers to software solutions with publicly accessible source code that track, analyze, and report on network device performance, traffic patterns, and availability. Unlike proprietary systems from vendors like SolarWinds or PRTG, these tools allow complete inspection of how monitoring works, modification of core functionality, and redistribution without per-device or per-user licensing costs.
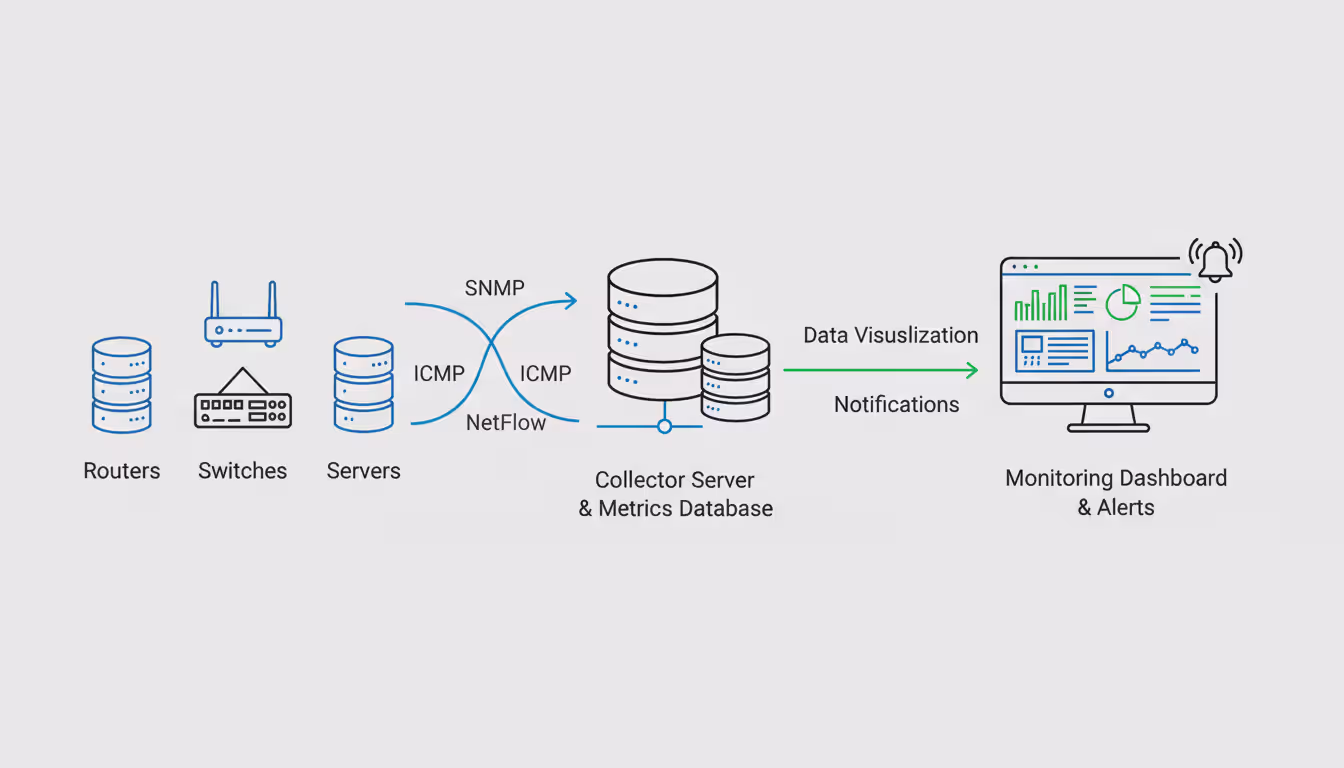
At its core, an open source network monitor performs three essential functions: data collection from network devices via protocols like SNMP, ICMP, or NetFlow; storage and processing of this telemetry data; and presentation through dashboards, alerts, or API endpoints. The "open source" designation means the underlying code follows licenses such as GPL, Apache, or MIT, granting users rights to study, modify, and share the software.
The practical difference between open source and proprietary monitoring becomes apparent during customization. When a team needs to monitor a proprietary protocol or integrate with an internal API, open source tools allow direct code modification. Proprietary solutions require vendor support tickets, feature requests, and potentially expensive custom development contracts. An infrastructure team monitoring specialized IoT devices or legacy industrial equipment can write custom collectors in Python or Go, deploy them within hours, and share improvements with the broader community.
Open source network monitoring software operates without artificial device limits. A company monitoring 50 switches pays the same as one monitoring 5,000—zero in licensing, though hardware and personnel costs scale with infrastructure size. This cost structure fundamentally changes capacity planning conversations. Instead of debating whether to monitor less critical devices to stay within license limits, teams decide based purely on operational value.
Author: Megan Holloway;
Source: baltazor.com
Why Organizations Choose Open Source Network Monitoring
Financial services firms, healthcare providers, and technology companies adopt open source network monitoring tools for reasons beyond cost savings. A regional bank might save $200,000 annually by replacing a commercial solution, but the decision often hinges on control and flexibility.
Customization represents the primary driver for many deployments. A managed service provider monitoring client networks needs to white-label dashboards, customize alert thresholds per client, and integrate with proprietary ticketing systems. Open source platforms allow these modifications without waiting for vendor roadmaps or paying for professional services. One MSP built custom modules to automatically provision monitoring for new client sites, reducing setup time from four hours to twelve minutes.
Community support creates a different dynamic than vendor support contracts. When a network engineer encounters a bug at 2 AM, the vendor support ticket might sit in a queue until business hours. With active open source projects, that engineer can search GitHub issues, find similar problems, review proposed patches, and sometimes implement fixes immediately. The Nagios community alone has contributed over 5,000 plugins for monitoring everything from satellite modems to brewery temperature sensors.
Transparency matters for security-conscious organizations. A defense contractor or healthcare system can audit every line of monitoring code, verify no telemetry leaves their network, and validate encryption implementations. Proprietary software requires trusting vendor claims. After several high-profile supply chain attacks in 2025, security teams increasingly demand this level of code visibility.
Avoiding vendor lock-in preserves strategic flexibility. Companies that built monitoring infrastructure around discontinued commercial products spent millions migrating to alternatives. Open source projects can fork if development stalls. The Icinga project emerged when Nagios development slowed, allowing organizations to migrate gradually while maintaining familiar workflows. This insurance policy against vendor decisions—price increases, feature removal, acquisition by competitors—carries real value.
How Open Source Network Monitoring Tools Work
Modern open source network monitoring software follows a distributed architecture with specialized components for collection, storage, processing, and presentation. Understanding this architecture helps teams design resilient monitoring systems.
Data collection starts with agents or agentless polling. Agentless monitoring uses protocols like SNMP to query devices directly—a collector sends requests every 60 seconds asking a router for interface statistics, CPU usage, and error counts. This approach works well for network equipment but provides limited visibility into application performance. Agent-based monitoring deploys small programs on servers that gather detailed metrics about processes, file systems, and application-specific data before sending it to central collectors.
The polling interval creates a trade-off between granularity and overhead. Checking devices every 30 seconds provides near-real-time visibility but generates significant network traffic and processing load. Five-minute intervals reduce overhead but might miss brief outages or performance spikes. Most teams settle on 60-second intervals for critical infrastructure and 5-minute intervals for less critical devices.
Author: Megan Holloway;
Source: baltazor.com
Storage systems must handle time-series data efficiently. A network with 1,000 monitored interfaces collecting 20 metrics each at 60-second intervals generates 28.8 million data points daily. Round-robin databases like RRDtool handle this by aggregating older data—keeping 60-second resolution for 24 hours, 5-minute averages for 7 days, and hourly averages for years. Time-series databases like InfluxDB or Prometheus offer more flexible retention policies and better query performance for large deployments.
Alerting mechanisms evaluate rules against incoming data. Simple threshold alerts trigger when CPU usage exceeds 80% for 5 minutes. More sophisticated rules use baselines—alerting when current traffic deviates significantly from historical patterns for this time and day. A university network might see 10 Gbps at 2 PM on Tuesday as normal but 1 Gbps as a potential problem indicating a circuit failure.
Alert fatigue kills monitoring effectiveness faster than any technical limitation. A poorly configured system generating 500 alerts daily trains staff to ignore notifications. Effective implementations use alert grouping (one notification for multiple related failures), escalation policies (page the on-call engineer only if the alert persists 15 minutes), and maintenance windows (suppress alerts during planned work).
Visualization transforms raw metrics into actionable information. A dashboard showing current interface utilization helps capacity planning. Graphs comparing this week's traffic to last week reveal trends. Topology maps with color-coded device status let operators identify problem areas instantly. The most valuable dashboards answer specific questions: "Is the network healthy?" for executives, "Which circuit is saturated?" for engineers, "Did the configuration change cause problems?" for change management.
Popular Open Source Network Monitoring Software
The ecosystem includes dozens of mature projects, each optimized for different use cases and organizational preferences.
Nagios remains the foundation for many enterprise monitoring deployments despite its 1999 origins. The core engine excels at service availability monitoring—checking whether devices respond, services accept connections, and certificates haven't expired. A basic Nagios setup monitors 200 devices with minimal configuration. The plugin architecture allows monitoring anything scriptable, from database query performance to API response times. However, the web interface feels dated, and scaling beyond 5,000 services requires careful tuning or distributed architectures. Organizations with existing Nagios expertise and straightforward monitoring needs find it reliable and well-documented.
Zabbix offers a more modern, integrated experience with a focus on auto-discovery and template-driven configuration. Point Zabbix at a network subnet, and it automatically finds devices, identifies their type, and applies appropriate monitoring templates. The built-in database stores configuration and metrics, simplifying deployment compared to Nagios's file-based configuration. Zabbix handles large environments well—deployments monitoring 100,000+ devices exist. The learning curve is steeper than simpler tools, and the Java-based frontend requires more resources. Teams managing dynamic environments where devices frequently change benefit from Zabbix's automation capabilities.
Prometheus revolutionized monitoring for cloud-native and containerized environments. Instead of polling devices, Prometheus scrapes HTTP endpoints where applications expose metrics. This pull model works elegantly with Kubernetes, where pods appear and disappear dynamically. The powerful query language enables complex analysis—calculating request rates, error percentages, and latency distributions. Prometheus lacks long-term storage and sophisticated alerting out of the box, requiring integration with Thanos or Cortex for retention and Alertmanager for notifications. Organizations running microservices architectures find Prometheus's service-oriented approach more natural than device-centric tools.
LibreNMS targets network operations teams specifically, with excellent support for network protocols, automatic discovery, and a clean PHP-based interface. It handles SNMPv3, supports thousands of device types out of the box, and includes network mapping features. The billing module tracks interface utilization for capacity planning or customer billing. LibreNMS works best for teams focused primarily on network infrastructure rather than servers or applications. A regional ISP monitoring routers, switches, and optical equipment across 50 points of presence would find LibreNMS well-suited to their needs.
Icinga evolved from Nagios, maintaining compatibility with Nagios plugins while modernizing the architecture. The Icinga 2 rewrite introduced a distributed monitoring model, REST API, and better performance. Icinga Web 2 provides a responsive interface with customizable dashboards and business process modeling. Organizations migrating from Nagios appreciate the familiar concepts with improved scalability and user experience.
Checkmk combines multiple monitoring approaches—Nagios core for alerting, agent-based collection for detailed server metrics, SNMP for network devices—into a unified platform. The automated service discovery and configuration management reduce setup time significantly. The commercial edition adds distributed monitoring and reporting, but the raw edition provides substantial functionality without cost. Teams wanting comprehensive monitoring with less manual configuration work find Checkmk's automation valuable.
Comparing Open Source Network Monitoring Solutions
Tool
Best For
Protocol Support
Scalability
Learning Curve
Community Size
Nagios
Service availability, simple checks
SNMP, ICMP, HTTP/S, custom plugins
5,000 services per instance
Low to moderate
Very large, 20+ years
Zabbix
Auto-discovery, template-driven monitoring
SNMP, IPMI, JMX, custom agents
100,000+ devices
Moderate to high
Large, active development
Prometheus
Cloud-native, microservices, time-series
HTTP metrics endpoints, exporters
Millions of time-series
Moderate
Very large, CNCF project
LibreNMS
Network-focused, ISP/MSP environments
SNMP, ICMP, extensive device library
10,000+ network devices
Low to moderate
Medium, network specialist
Icinga
Nagios migration, distributed monitoring
SNMP, ICMP, HTTP/S, Nagios plugins
200,000+ services (distributed)
Moderate
Medium, growing
Checkmk
Comprehensive monitoring, automation
SNMP, custom agents, multiple protocols
50,000+ services
Moderate
Medium, hybrid open/commercial
Selecting the appropriate tool requires matching capabilities to requirements. A startup running containerized applications on Kubernetes would waste time configuring Nagios when Prometheus integrates naturally with their infrastructure. Conversely, a manufacturing company monitoring building automation systems and legacy PLCs benefits from LibreNMS's extensive SNMP device support rather than learning Prometheus's service-oriented model.
We evaluated four open source network monitoring platforms before settling on Zabbix for our healthcare network.The auto-discovery saved us hundreds of hours during the initial deployment across 23 hospitals. When we acquire a new facility, we can have monitoring operational in hours rather than weeks. The template system means our junior engineers can deploy standardized monitoring without deep expertise
— Marcus Chen
Implementing Open Source Network Monitoring in Cloud Environments
Cloud infrastructure introduces challenges that traditional network monitoring wasn't designed to handle. Resources appear and disappear automatically, IP addresses change, and the underlying network infrastructure remains invisible to tenants.
Integration with open source cloud management platforms like OpenStack or CloudStack requires monitoring systems that understand ephemeral resources. A virtual machine might exist for 20 minutes to process a batch job, then terminate. Traditional monitoring would generate alerts about the "failed" device. Cloud-aware monitoring recognizes the instance termination as normal operation and removes it from monitoring automatically.
Service discovery mechanisms replace static configuration files. Prometheus's Kubernetes service discovery automatically finds pods, services, and nodes, applying labels that enable flexible queries. Zabbix's low-level discovery rules can query cloud APIs to find instances tagged for monitoring. This automation becomes essential when infrastructure scales beyond manual management—a development team deploying 50 microservices shouldn't need to file monitoring tickets for each one.
Author: Megan Holloway;
Source: baltazor.com
Scalability considerations differ in cloud environments. Horizontal scaling—adding more collector instances—works better than vertical scaling—buying bigger servers. Prometheus federates multiple instances, each responsible for a subset of targets. Zabbix proxy servers distribute collection load across regions or availability zones. This distributed architecture provides resilience; if one collector fails, others continue operating.
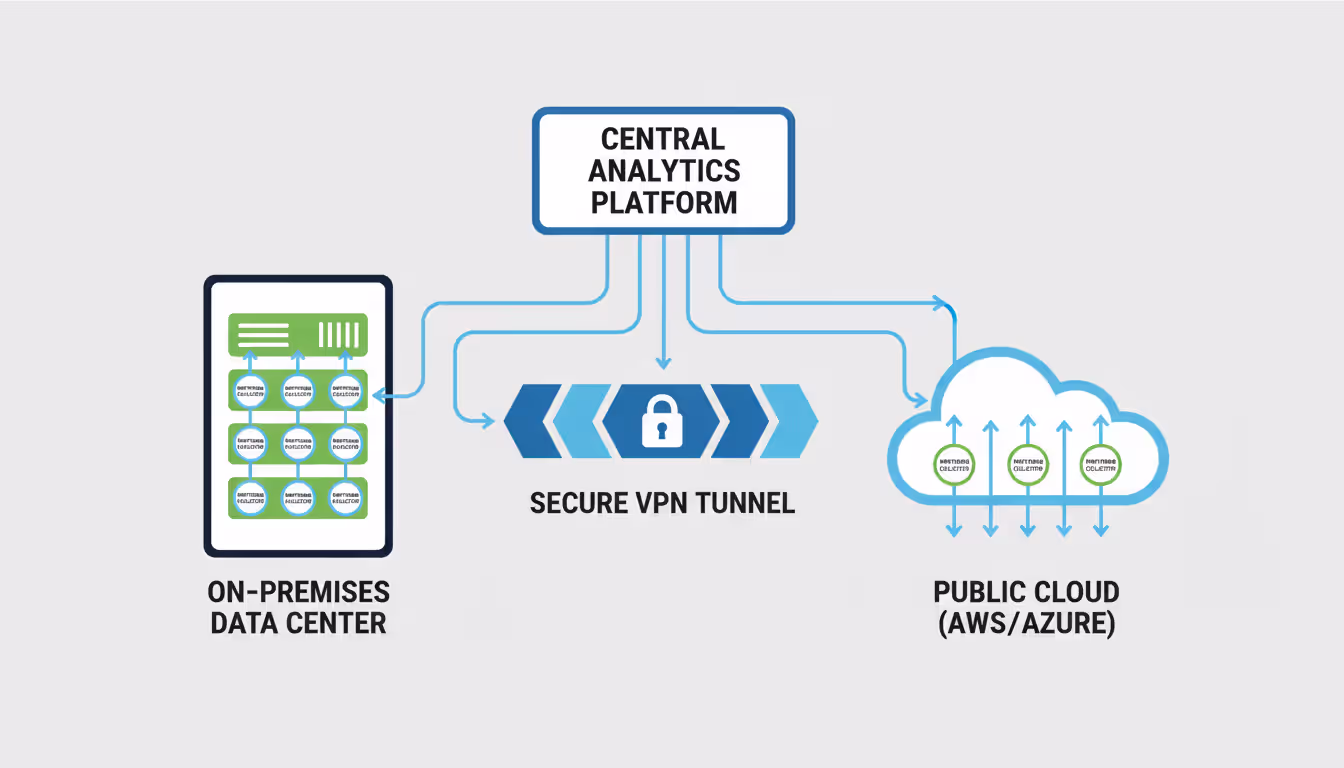
Hybrid setups monitoring both on-premises data centers and public cloud resources need careful network design. A monitoring server in AWS can't directly reach devices in a corporate data center without VPN or direct connect circuits. Some organizations deploy collectors in each environment, forwarding data to a central analysis platform. Others use agent-based monitoring where agents inside each network segment push data outbound, avoiding inbound firewall rules.
Open source cloud platforms benefit from native monitoring integration. OpenStack's Ceilometer collects telemetry from compute, storage, and network services. Integrating this data with network monitoring provides a complete infrastructure view—correlating VM performance problems with underlying network saturation. A storage API slowdown might trace to a saturated 10GbE link between compute and storage nodes, invisible without monitoring both layers.
Cost optimization in cloud environments requires monitoring resource utilization closely. An instance running at 5% CPU utilization wastes money. Monitoring data identifies right-sizing opportunities—downgrading instance types, terminating idle resources, or scheduling workloads during cheaper off-peak hours. One SaaS company reduced cloud costs 23% by using monitoring data to identify and eliminate waste.
Common Mistakes When Deploying Open Source Network Monitor Systems
Underestimating resource requirements causes many failed deployments. A monitoring server collecting metrics from 2,000 devices, storing 30 days of data, and serving dashboards to 20 users needs substantial CPU, memory, disk I/O, and network bandwidth. Teams deploy monitoring on an old desktop-class server, then wonder why dashboards load slowly and alerts arrive late. Right-sizing requires calculating data ingestion rates, storage growth, and query patterns. A rough formula: 1 CPU core per 500 actively monitored services, 4GB RAM per 1,000 services, and SSD storage for time-series databases.
Poor initial configuration creates technical debt that haunts operations for years. Accepting default check intervals, thresholds, and alert rules generates noise without insight. A 90% disk space threshold might be appropriate for a database server but ridiculous for a log aggregator that regularly hits 95% before log rotation. Effective configuration requires understanding normal behavior for each device type, application, and service. Baseline monitoring for two weeks before enabling alerts, then tune thresholds based on observed patterns.
Author: Megan Holloway;
Source: baltazor.com
Neglecting updates exposes systems to security vulnerabilities and bugs. The monitoring platform has privileged access to network devices via SNMP community strings or SSH credentials. A compromised monitoring server becomes a pivot point for network-wide attacks. Establish update schedules—security patches within one week, minor updates monthly, major version upgrades annually with testing. Subscribe to security mailing lists for the chosen platform to receive vulnerability notifications.
Lack of documentation turns monitoring into tribal knowledge. The engineer who configured custom checks leaves the company, and nobody understands why certain alerts fire or what the dashboard graphs represent. Document the monitoring architecture, custom plugins, threshold justifications, and escalation procedures. When an alert fires at 3 AM, the on-call engineer shouldn't need to reverse-engineer the check logic to determine if it's actionable.
Ignoring alert fatigue destroys monitoring effectiveness. If the team receives 100 alerts daily, they'll start ignoring all of them—including the critical ones. Implement alert tuning as an ongoing process. Track alert frequency and resolution. Alerts that fire frequently but never require action should be removed or have thresholds adjusted. Alerts that fire once monthly and always indicate real problems deserve prominent placement.
Monitoring the monitoring system itself gets overlooked until the monitoring server fails and nobody notices for hours. Deploy a separate, simple monitor that checks the primary monitoring system's health. A basic Nagios instance on a different server checking that the main Zabbix server responds provides this meta-monitoring. Cloud-based synthetic monitoring services offer another option—an external service checking that your monitoring dashboards load.
Frequently Asked Questions About Open Source Network Monitoring
What is the best open source network monitoring tool?
No single tool fits every environment. Prometheus excels for cloud-native and containerized applications. Zabbix handles large, diverse environments with extensive auto-discovery. LibreNMS specializes in network infrastructure monitoring. Nagios remains reliable for straightforward service checks. Evaluate tools based on your infrastructure type, team expertise, and specific requirements rather than seeking a universal "best" option.
Is open source network monitoring secure?
Security depends on implementation, not the open/proprietary distinction. Open source code allows security audits, vulnerability discovery, and rapid patching by the community. However, teams must apply updates, configure authentication properly, encrypt communications, and follow security best practices. A poorly configured open source system is less secure than a well-maintained proprietary one, and vice versa. The transparency of open source enables security when combined with competent administration.
Can open source network monitoring tools work with cloud platforms?
Modern open source monitoring tools integrate well with AWS, Azure, Google Cloud, and private cloud platforms like OpenStack. Prometheus includes native Kubernetes service discovery. Zabbix offers cloud-specific templates and API integrations. Most tools support agent-based monitoring that works identically in cloud and on-premises environments. The key is choosing tools designed for dynamic infrastructure rather than static device lists.
How much does it cost to implement open source network monitoring?
Software licensing costs zero, but implementation requires personnel time, hardware or cloud resources, and ongoing maintenance. A small deployment monitoring 100 devices might require 40 hours of engineering time for setup ($4,000-8,000 in labor) plus $100-200 monthly for server resources. Large deployments monitoring 10,000 devices could require dedicated staff, substantial hardware, and integration work totaling $50,000-150,000 in first-year costs. Compare these to proprietary solutions charging $50-200 per device annually in perpetual costs.
What skills are needed to manage open source network monitoring software?
Basic deployments require Linux system administration, networking fundamentals (TCP/IP, SNMP, protocols), and the monitoring platform's configuration language. Advanced deployments add scripting (Python, Bash, PowerShell), database management, and potentially programming for custom collectors. A network engineer with Linux experience can deploy and maintain Nagios or LibreNMS. Prometheus in Kubernetes environments requires container orchestration knowledge. Teams can start with basic skills and develop expertise through documentation and community resources.
How does open source network monitoring compare to paid solutions?
Open source platforms offer comparable or superior technical capabilities to commercial products, especially for standard monitoring use cases. Proprietary solutions provide integrated support contracts, polished interfaces, and sometimes unique features like advanced analytics or AI-driven anomaly detection. The trade-off involves control and cost versus convenience and vendor support. Organizations with strong technical teams often prefer open source flexibility and cost structure. Those prioritizing vendor support and rapid deployment might choose commercial options despite higher costs.
Open source network monitoring delivers enterprise-grade visibility without the licensing costs, vendor restrictions, or black-box limitations of proprietary platforms. Organizations gain control over their monitoring infrastructure, flexibility to customize for specific needs, and freedom from vendor lock-in while accessing mature, battle-tested tools.
Success requires matching the right tool to your environment—Prometheus for cloud-native applications, Zabbix for diverse infrastructure with automation needs, LibreNMS for network-focused monitoring, or Nagios for straightforward service checks. Implementation demands careful planning around resource requirements, configuration, and ongoing maintenance, but the investment pays dividends through improved uptime, faster incident response, and lower total cost of ownership.
The monitoring landscape continues evolving toward cloud-native architectures, service-oriented monitoring, and AI-assisted analysis. Open source projects adapt rapidly to these changes, driven by communities of practitioners solving real operational problems. Teams building monitoring infrastructure in 2026 have access to powerful, proven tools that scale from small deployments to global enterprises—without the financial and strategic risks of proprietary vendor dependence.
A software defined network (SDN) separates control intelligence from physical equipment, enabling centralized management and programmable network behavior. Discover the three-layer architecture, key components, and how SDN transforms enterprise networking
A complete guide to setting up an intranet for your organization. Covers planning requirements, choosing between cloud and self-hosted platforms, technical setup steps, common mistakes to avoid, and strategies for maintaining and scaling your intranet over time
Remote desktop hosting delivers centralized desktop environments accessible from anywhere. This guide covers infrastructure selection, security implementation with multi-factor authentication and VPN, printing solutions, and common pitfalls to avoid when deploying remote desktop services for your business
Private cloud infrastructure dedicates computing resources to a single organization, offering control and compliance advantages over shared public cloud. This guide examines architecture, platform choices, managed services options, and decision criteria for enterprises evaluating private cloud deployment
The content on this website is provided for general informational and educational purposes only. It is intended to explain concepts related to cloud computing, computer networking, infrastructure, and modern IT systems.
All information on this website, including articles, guides, and examples, is presented for general educational purposes. Technology implementations may vary depending on specific environments, business needs, infrastructure design, and technical requirements.
This website does not provide professional IT, engineering, or technical advice, and the information presented should not be used as a substitute for consultation with qualified IT professionals.
The website and its authors are not responsible for any errors or omissions, or for any outcomes resulting from decisions made based on the information provided on this website.