You're managing a network on a shoestring budget. Your boss expects 99.9% uptime, but commercial monitoring platforms cost thousands per year. Here's the good news: today's free network monitoring software can handle serious production workloads, not just lab environments.
I've watched these tools mature over the last decade. What started as clunky command-line utilities now includes polished dashboards that rival paid products. You won't pay licensing fees, though you'll invest time learning the quirks of each platform.
The reality check? Every free tool makes compromises. Maybe you're capped at monitoring 50 devices. Maybe configuration happens in text files instead of wizards. Maybe you'll troubleshoot issues alone when vendor support isn't an option. Your job is figuring out which compromises you can live with.
What Is Network Monitoring Software and Why Use Free Tools
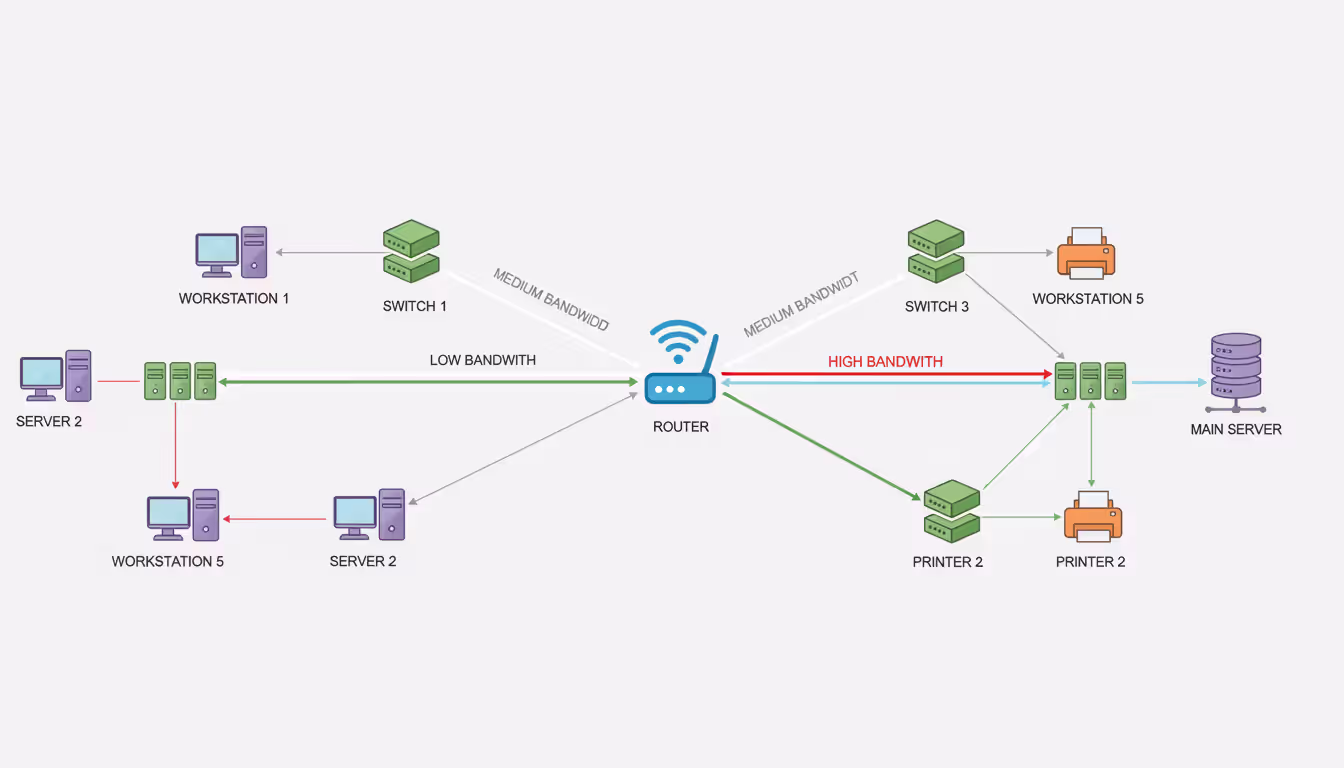
Picture a security guard walking through your building every hour, checking that doors lock properly and lights work. Network monitoring software does this for your digital infrastructure—except it checks every minute (or every second) and never needs coffee breaks.
The software polls your routers, switches, servers, and other gear for status updates. How's the CPU usage? Are network interfaces dropping packets? Is that server's hard drive filling up? When something crosses a threshold you've set, you get an alert before users start complaining.
You'll find three flavors of "free" in this space. True open-source projects like Nagios Core and Zabbix cost nothing and never will—the code's published under GPL or similar licenses. Freemium products like PRTG give you limited functionality (say, 100 sensors) with the option to pay for more. Then there's trial software masquerading as free, which expires after 30 days. We're ignoring that last category.
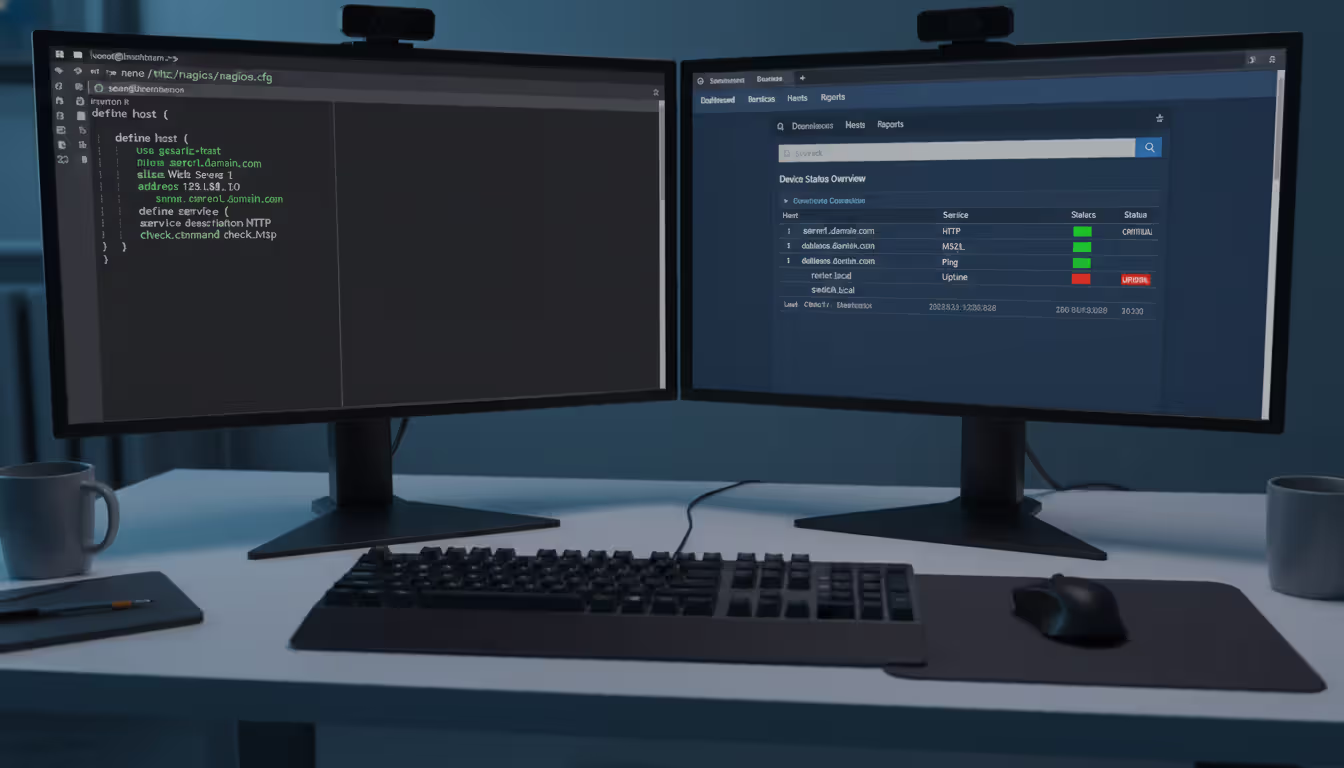
Open-source tools don't hold your hand during installation. You're editing configuration files, setting up databases, and reading documentation that assumes you know what SNMP OIDs are. The payoff? No artificial device limits and total control over customization.
Freemium tools install in 15 minutes and look gorgeous immediately. Click through setup wizards, auto-discover your network, and you're monitoring before lunch. The catch arrives when you hit their device cap or need a feature they've locked behind a paywall.
Author: Logan Kessler;
Source: baltazor.com
When does free actually work long-term? I'd say any network under 100 devices where you've got someone technical on staff. A dental office with three locations, two servers, and a handful of network gear? Perfect fit. A nonprofit running on donated equipment? Absolutely. Your home lab where you're studying for certifications? Obviously.
The walls appear once you scale up. That 100-sensor limit in PRTG sounds generous until you're monitoring 30 servers with four checks each (CPU, memory, disk, network). Now you're at 120 sensors with no room for switches or routers. You'll either pay up or get creative with what you monitor.
Support becomes self-service with free versions. Encounter a bug at 3 AM? You're searching forums and GitHub issues, not calling a vendor hotline. Documentation quality varies wildly—Zabbix has encyclopedic guides, while smaller projects might offer a sparse wiki and hopes.
I spent three weekends configuring Nagios for our 40-device network. Frustrating? Absolutely. Worth it? Yeah, because I learned more about SNMP, monitoring methodology, and our actual infrastructure than two years of just keeping things running. Plus we've saved about $3,000 annually versus what we'd pay for SolarWinds
— Marcus Chen
Key Features to Look for in Free Network Monitoring Software
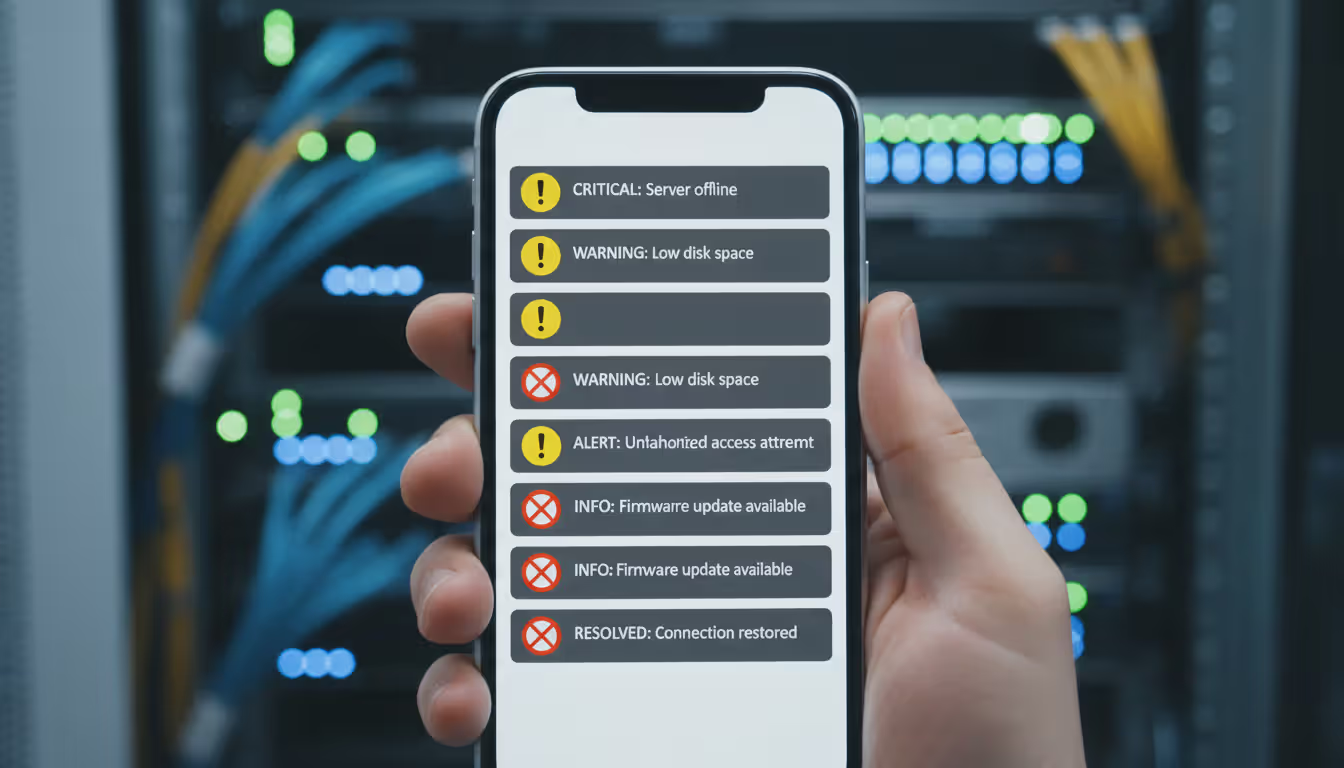
Real-time alerting separates toys from tools. Your free network monitor needs to scream when thresholds break, not politely mention it in a daily report. Email alerts are table stakes. SMS or webhook integration? Even better, since you're not always checking email at 2 AM.
The trick is configuring alerts that matter. "Device down" notifications are obvious. More valuable? "This switch interface has exceeded 75% utilization for 10 straight minutes" or "Server memory usage spiked 30% in the last hour." Granular thresholds catch problems before they become outages.
Watch for alert dependencies and escalation rules. When your core switch dies, 50 connected devices go offline too. You don't want 51 alerts flooding your phone. Smart tools let you define dependencies—only alert on the root cause, suppress downstream notifications until it's fixed.
Bandwidth monitoring answers the question "who's eating all my internet?" NetFlow support is your friend here. Your router exports flow data, the monitoring tool collects it, and suddenly you can see which department streams 4K videos all day.
Basic tools show total throughput as a line graph. Useful, but limited. Better free network mapping software breaks down traffic by source, destination, protocol, and application. You'll spot the backup job someone scheduled for 9 AM instead of 2 AM, or the compromised workstation participating in a botnet.
Some free versions cripple NetFlow features. They'll show you have 90% utilization but won't reveal what's causing it. Read the fine print before committing.
Device discovery saves hours of manual inventory work. Point the tool at your network subnets, let it scan, and watch it populate a device list. SNMP-enabled gear reveals model numbers, serial numbers, firmware versions, and interface configurations automatically.
The quality gap between discovery implementations is massive. Weak scanners find IP addresses and maybe MAC addresses—that's it. Strong scanners leverage LLDP and CDP data from switches to map physical connections, identify device types, and even pull running configs from network gear.
Auto-discovery should run on schedules. Your network changes constantly—new printers appear, old workstations get decommissioned, someone adds a rogue access point. Weekly discovery scans keep your inventory current without manual updates.
Author: Logan Kessler;
Source: baltazor.com
SNMP support isn't negotiable for serious monitoring. Version 2c remains common because it's simple, though it sends community strings (basically passwords) in cleartext. Version 3 adds authentication and encryption—use it for anything internet-facing or security-sensitive.
Free tools handle SNMP with varying competence. Some poll reliably under load. Others drop SNMP traps when the monitoring server gets busy. Test your tool's SNMP performance by flooding it with traps and seeing what it catches.
Scalability limits require math before installation. PRTG explicitly caps you at 100 sensors in the free tier. But Zabbix? "Unlimited" depends entirely on your hardware and how well you tune MySQL. I've seen Zabbix installations monitoring 20,000 devices on a beefy server, and others struggling with 1,000 on undersized hardware.
One "sensor" or "check" typically means one metric from one device. Monitoring a server's CPU is one sensor. Memory makes two. Each disk partition adds more. That 100-sensor limit covers fewer devices than you'd guess.
Dashboard and UI quality matters more than you'd think. During an outage, you need information fast. Clunky interfaces with nested menus slow you down when every second counts. Customizable dashboards that surface critical metrics at a glance? That's what separates professional tools from hobbyist projects.
Mobile responsiveness helps if you're on call. Some free network software hasn't been updated since smartphones became ubiquitous. You'll pinch-and-zoom on tiny text while an outage burns. Others offer native mobile apps or responsive web interfaces that actually work on a phone.
Top Free Network Monitoring and Discovery Tools Compared
Platform
Monitoring Capacity
Core Capabilities
Ideal Use Case
System Requirements
PRTG (free tier)
100 sensors maximum
Auto-detection, prebuilt sensors, mobile applications, flow analysis
Networks under 30 devices wanting minimal setup effort
Windows Server platform (monitors any device type)
Zabbix
No hard limits
Multi-site deployment, templating engine, forecasting tools, REST API
50-5000 device networks with Linux expertise available
Linux primary, Windows secondary, containers supported
Nagios Core
No licensing caps
5,000+ community plugins, scriptable responses, granular alerts
PRTG's free edition works brilliantly until you bump into that 100-sensor wall. Installation on Windows Server takes maybe 20 minutes—download, run the installer, open your browser to the web interface. The auto-discovery wizard finds your devices, applies appropriate sensors automatically, and you're monitoring before you finish your coffee.
The sensor concept confuses people initially. You're not limited to 100 devices—you're limited to 100 individual checks. A single server might consume 8 sensors (CPU, memory, three disk volumes, two network interfaces). Twenty servers and you've used 160 sensors, which obviously won't fit. You'll make hard choices about what matters most.
The interface feels polished and modern because Paessler (the company behind PRTG) sells the commercial version. They invested in UX because that's how they compete with SolarWinds and similar vendors. You benefit from that in the free tier.
Zabbix handles enterprise-scale workloads despite costing zero dollars. I know networks running 10,000+ devices on Zabbix. The learning curve is brutal if you're unfamiliar with Linux system administration. Expect to spend a solid week reading documentation before you're productive.
Templates are Zabbix's superpower. Create one template for "Dell PowerEdge servers," apply it to 50 servers, and they all get monitored identically. Update the template later, and changes propagate automatically. The community maintains thousands of templates for common equipment—you're usually importing and tweaking, not building from scratch.
Distributed monitoring lets you deploy Zabbix proxies at remote sites. Each proxy collects data locally, then forwards to your central server. This architecture scales horizontally across geographic locations without drowning in WAN traffic.
Nagios Core basically invented open-source monitoring back in the late 1990s. The interface looks it. You'll configure everything by editing text files on the command line. No wizards, no drag-and-drop, just you and a text editor defining hosts, services, and notification rules.
Why tolerate that in 2024? The plugin ecosystem remains unmatched. Someone wrote a Nagios plugin for literally every protocol, service, and application you can imagine. Monitoring an obscure industrial controller via Modbus? There's a plugin. Custom web application with a weird API? Write a bash script that returns exit codes, and Nagios will monitor it.
Nagios XI (the commercial version) adds the modern interface most administrators want. The free core version stays relevant for teams treating infrastructure-as-code seriously—your monitoring config lives in Git alongside everything else.
Author: Logan Kessler;
Source: baltazor.com
Spiceworks bundles monitoring with help desk ticketing and IT asset management. The catch? Ad-supported. You'll see banner ads in the interface, which funds the free product. Some organizations tolerate this; others find it unprofessional.
Cloud-based monitoring means no server to maintain locally. Spiceworks' infrastructure does the polling, which sounds convenient until you consider they're accessing your network from the internet. Review their security whitepaper carefully before deploying in sensitive environments.
The integrated help desk creates a nice workflow—monitoring detects a printer offline, automatically creates a ticket, user reports it via the self-service portal, you resolve both simultaneously. For small IT teams wearing multiple hats, this integration saves time.
LibreNMS emerged from an Observium licensing controversy years ago. The community wanted truly free software, so they forked the codebase and built LibreNMS. It inherited Observium's strong auto-discovery and visualization while adding distributed polling for multi-site networks.
API-first design makes LibreNMS automation-friendly. Write scripts that pull monitoring data, trigger discoveries, or acknowledge alerts programmatically. This matters in DevOps-heavy environments where you're orchestrating everything through code.
Installation requires comfort with Linux command line, MySQL or PostgreSQL database setup, and web server configuration. Not insurmountable, but definitely not a Windows wizard clicking "Next" five times.
Icinga 2 started as a Nagios fork when that project's development stalled. It's since evolved into its own beast, embracing modern practices like declarative configuration, native clustering, and comprehensive REST APIs. The director add-on provides a web interface for configuration, reducing the command-line burden significantly.
If you're already managing infrastructure with Puppet, Ansible, or Terraform, Icinga fits naturally into those workflows. Define your monitoring alongside your infrastructure code, version control everything together, and deploy changes through your existing pipelines.
Clustering enables true high availability. Run two Icinga instances that sync configuration and state. If one dies, the other keeps monitoring without interruption. Most free tools make you rebuild from backups if your monitoring server fails.
Observium Community Edition wins beauty contests among free monitoring tools. The graphs are genuinely gorgeous—clear, colorful, and information-dense without feeling cluttered. Trends jump out visually in ways that help you spot patterns quickly.
The 250-device cap is generous for small-to-medium networks. Where Observium falls short is alerting—the features exist but feel underdeveloped compared to Zabbix or Nagios. Some teams use Observium for visualization while running another tool for alerts. Not ideal, but it works.
Community edition updates lag behind the paid Professional version, sometimes by months. You're not getting the latest features or bug fixes promptly. For a stable network that doesn't change much, this matters less than for a rapidly evolving environment.
How to Choose the Right Free Network Monitor for Your Needs
Count your devices honestly before choosing. Under 25 devices with straightforward monitoring needs? PRTG's free tier or Spiceworks handles this comfortably. You'll have monitoring running by the end of the day.
Between 25-100 devices, you're in the danger zone for freemium products. Calculate sensor count realistically. Each server needs CPU, memory, disk, and network checks minimum—that's 4-6 sensors right there. Switches need per-interface monitoring. Add it up before committing to PRTG's 100-sensor limit.
Over 100 devices, forget freemium—go straight to unlimited open-source options. Zabbix, Nagios, or LibreNMS won't cap you at arbitrary limits. Your only ceiling is hardware capacity and configuration expertise.
Operating system preferences matter mostly for the monitoring server itself. These tools monitor anything speaking SNMP or allowing agent installation regardless of OS. But the monitoring platform has requirements.
Running Windows Server already? PRTG installs natively and feels at home. Pure Linux shop? Zabbix or LibreNMS make more sense than trying to shoehorn Windows into your environment. Mixed environment? Container-based deployments (Icinga, Zabbix) work anywhere Docker runs.
Consider what your team already knows. Forcing a Windows admin to learn Linux just for monitoring is possible but inefficient. Play to existing strengths unless you're specifically trying to build new skills.
Technical expertise available should heavily influence your choice. Got a team member comfortable editing YAML files, troubleshooting database queries, and reading application logs? Nagios or Zabbix reward that expertise with infinite flexibility.
Team maxes out at "I can install Windows applications?" PRTG or Spiceworks minimize the pain. You'll sacrifice customization for usability, but you'll actually get monitoring deployed instead of spending six months learning Linux administration.
Honest assessment matters here. Don't pick Nagios because it sounds impressive, then abandon it three weeks in when you're drowning in documentation. Match the tool to your actual technical capacity, not aspirational capacity.
Community size and activity replace vendor support for free tools. Before committing, browse the community forums. Are questions answered within hours or do they languish for weeks? Check GitHub issue response times. Are maintainers actively developing or has the project stagnated?
Zabbix and Nagios benefit from decades of accumulated community knowledge. Almost any question you have, someone asked and answered years ago. Newer projects have smaller communities—sometimes passionate and helpful, sometimes nearly nonexistent.
Documentation quality varies wildly. Zabbix documentation is exhaustive (almost overwhelming). Smaller projects might offer a GitHub README and hope for the best. You'll spend hours in documentation—make sure it exists and makes sense before investing time in installation.
Plan for growth even if you're small today. That 20-device network might be 50 devices next year. PRTG's free tier works now, but will you hit limits in 18 months? Then what—pay for licenses or migrate everything to a new platform?
Some tools scale seamlessly. Zabbix grows from ten to ten thousand devices on the same software, you just add hardware. PRTG requires a license purchase at 101 sensors, which is fine if you've budgeted for it. Observium Community caps at 250 devices with no upgrade path except the paid Professional version.
Know the exit strategy before you enter. If you'll eventually outgrow free tools, choose one with a clear commercial upgrade path. If you're committed to free forever, choose tools without artificial limits from the start.
Integration requirements often get overlooked until you need them. Feeding monitoring data into your SIEM? You'll need syslog export or API access. Want automated remediation when alerts fire? Event handlers or webhook support become essential.
Are you building custom dashboards in Grafana? Check if the monitoring tool exports metrics in Prometheus, InfluxDB, or Graphite formats. Not all free tools play nicely with others—some expect you to use only their built-in interface.
Planning ChatOps integration so alerts post to Slack or Teams? Verify webhook or API capabilities before installation. Bolting on integrations after the fact ranges from easy to impossible depending on the tool's architecture.
Setting Up Your Free Network Monitoring Tool
Installation and Initial Configuration
Download only from official project websites, never third-party download mirrors that might bundle malware alongside legitimate software. For open-source tools, verify GPG signatures if provided. PRTG's Windows installer comes directly from paessler.com—anything else is suspicious.
Windows tools install like any application—download the .exe or .msi, accept UAC prompts, click through the wizard. Linux installations vary from one-command package manager installs (apt install zabbix-server-mysql) to multi-step source compilations. Read the installation guide completely before starting, not paragraph-by-paragraph as you go.
Security configuration happens immediately after installation, not "later when you have time." Change every default password—database, web interface, admin accounts, everything. Default credentials leak constantly in data breaches. Attackers scan for monitoring tools using default passwords because they provide privileged network access.
Restrict web interface access to management networks if possible. No reason for the entire internet to reach your monitoring dashboard. Configure firewall rules allowing only necessary inbound connections. HTTPS with valid certificates isn't optional—monitoring credentials deserve encryption.
Database setup confuses people new to tools like Zabbix and LibreNMS. MySQL or PostgreSQL performance directly determines how many devices you can monitor. Undersized databases become bottlenecks long before your CPU struggles. Allocate adequate memory (4GB minimum for production monitoring), tune query cache settings, and enable slow query logging to identify performance problems.
Time synchronization across all monitored devices prevents timeline confusion. If your monitoring server's clock shows 2:00 PM but your switch thinks it's 2:15 PM, correlating events during troubleshooting becomes guesswork. Configure NTP everywhere, using the same time source. Clock drift causes more subtle problems than you'd expect.
Adding Devices and Mapping Your Network
Auto-discovery works best when you've prepared SNMP credentials first. Configure SNMP community strings (v2c) or authentication/privacy passphrases (v3) on your network gear before scanning. Otherwise discovery just finds IP addresses without details—not particularly useful.
Start discovery against a small subnet initially, not your entire network. Learn how the tool behaves with 20 devices before throwing 200 at it. Discovery scans typically complete in 5-30 minutes depending on subnet size, device count, and response times. Review results carefully—you'll often find forgotten devices or unauthorized equipment nobody remembered deploying.
Manual device addition gives you more control than auto-discovery. Add critical infrastructure first: core network gear, important servers, anything whose failure means angry users or lost revenue. Apply appropriate monitoring templates based on device type. Servers need different checks than switches—disk space and process monitoring for servers, interface statistics and spanning tree status for switches.
Organize devices into logical groups immediately. Groups by location ("Chicago Office," "New York Datacenter"), function ("Web Servers," "Database Servers"), or criticality ("Production," "Development," "DR Site"). Bulk configuration changes become trivial when you can apply settings to groups instead of individual devices.
Free network mapping software capabilities differ dramatically between platforms. Observium generates beautiful automatic topology maps by analyzing LLDP/CDP neighbor data from switches. Nagios requires third-party plugins that produce mediocre results. LibreNMS falls somewhere in between—functional maps that won't win design awards.
Accurate maps prove invaluable during outages. When that aggregation switch fails, you need to immediately see which access switches and devices it connected. Manual documentation goes stale the week you create it. Automatically generated maps stay current as your network changes.
Configuring Alerts and Notifications
Start with conservative thresholds and tighten gradually based on observed behavior. Setting CPU alerts at 70% might trigger constantly on a server that normally runs at 65%. You'll train yourself to ignore alerts, defeating their purpose entirely.
Monitor without alerting for the first week. Collect baseline data showing normal behavior. That email server hits 90% CPU every morning during backup? That's normal, not an emergency. Configure thresholds above normal fluctuations but below actual problems.
Alert escalation matches notification urgency to team structure. Low-priority alerts (printer offline, non-critical server hitting 80% disk) go to shared email queues checked during business hours. Medium alerts (production server crossing thresholds) page on-call staff immediately. Critical alerts (core infrastructure down) wake up everyone including management.
Author: Logan Kessler;
Source: baltazor.com
Time delays prevent notification spam during brief hiccups. Don't alert on the first CPU spike—wait until it sustains for five minutes. Temporary bursts happen constantly in healthy networks. Sustained threshold violations indicate real problems.
Alert dependencies stop notification avalanches during cascading failures. Your core switch dies, 50 connected devices go offline simultaneously. Without dependencies, you'll receive 51 alerts in 60 seconds. With dependencies configured, only the root cause (switch failure) alerts immediately. Dependent device alerts suppress until connectivity restores.
Test your alerting thoroughly before trusting it. Intentionally trigger alerts by unplugging devices or simulating failures. Verify notifications arrive through all configured channels within your expected timeframe. Discover your SMS provider blocks automated messages now, not during a 3 AM outage.
Email alerts often land in spam folders initially. Work with your mail admin to whitelist the monitoring server. Test from multiple email clients. Mobile email apps sometimes filter differently than desktop clients.
Common Mistakes When Using Free Network Software
Underestimating sensor consumption trips up new PRTG users constantly. "100 sensors is plenty for my 40-device network" they think. Then reality hits—40 devices with CPU, memory, and disk checks plus interface monitoring consumes 200+ sensors. You're over the cap before monitoring network gear.
Calculate realistically before committing to capped free tiers. Every metric from every device costs one sensor. That counter increments faster than you'd guess. Better to choose unlimited tools from the start than migrate everything six months in.
Alert fatigue from poor thresholds destroys monitoring effectiveness. When every minor blip generates alerts, your team learns to ignore them. Then real outages get overlooked in the noise. I've seen environments generating 200 alerts daily—none of which anyone reads.
Be ruthless about alert value. Each notification should indicate something requiring human attention, not just reporting normal operations. "Server rebooted" isn't always actionable. "Server rebooted five times in one hour" definitely is.
Conversely, monitoring only ping status misses performance degradation. Devices don't just die—they slow down first. Catch rising latency, increasing packet loss, or climbing resource usage before total failure. Prevention beats firefighting.
Skipping software updates exposes monitoring infrastructure to published vulnerabilities. Monitoring tools have privileged access across your network, making them valuable attack targets. Compromised monitoring gives attackers visibility into your entire infrastructure plus credentials stored in configurations.
Subscribe to security announcement mailing lists for your chosen tool. Test updates in a lab environment before production deployment. Yes, this takes time. So does recovering from a breach that started through your unpatched monitoring server.
Update cadences vary by tool. PRTG releases stable updates quarterly with hotfixes as needed. Zabbix follows a similar schedule. Smaller open-source projects might update sporadically or constantly depending on maintainer activity. Know your tool's release patterns and budget time accordingly.
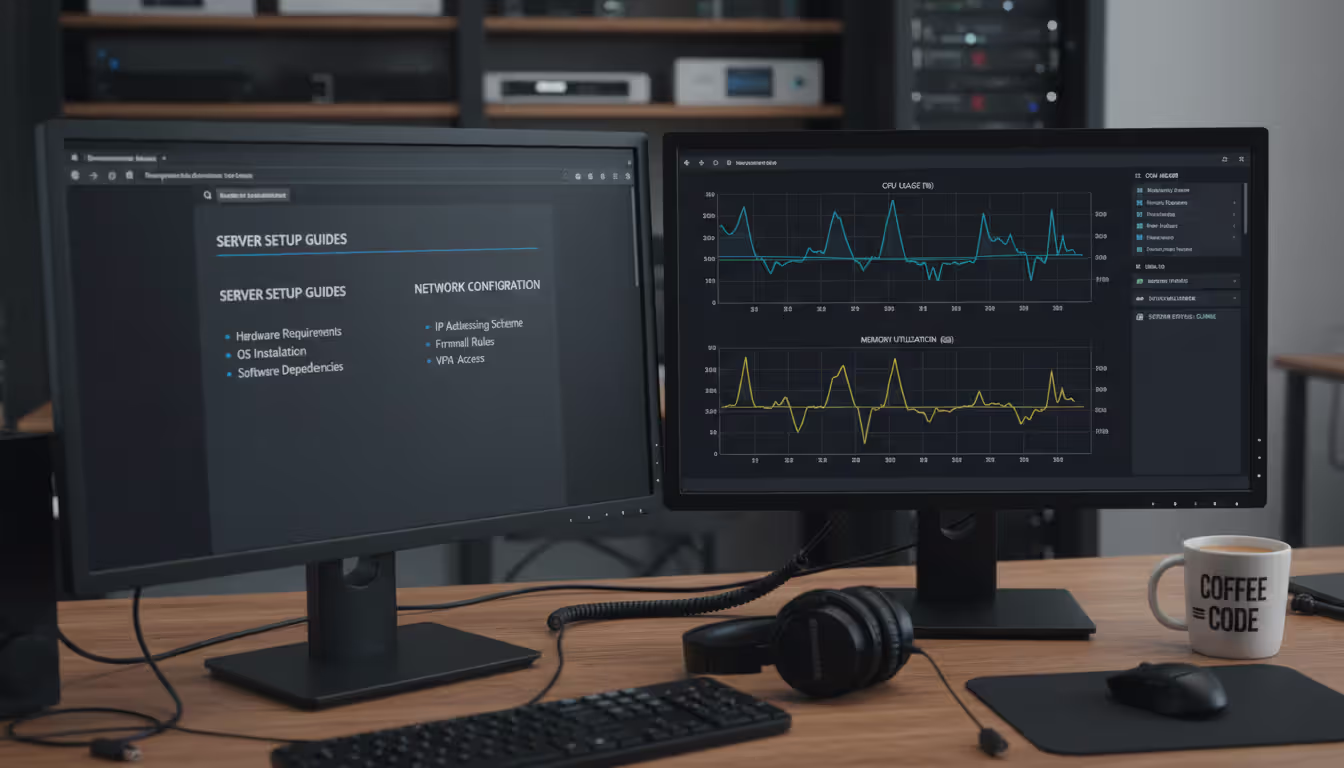
Configuration documentation always gets skipped in the rush to deploy. Six months later, you're staring at a complex alert rule with no memory of why you configured it that way. New team members inherit monitoring systems with zero knowledge of architectural decisions.
Document while configuring, not afterward. Maintain a wiki, shared document, or even well-commented config files explaining your choices. Why did you set that threshold at 85% instead of 80%? What does that custom script actually check? Which devices are in the "critical infrastructure" group?
Documentation seems like busywork until someone leaves or gets sick. Then it's the difference between maintaining operations smoothly and scrambling to reverse-engineer everything.
Monitoring overkill wastes resources and obscures important signals. Polling devices every 30 seconds generates 10x the data compared to five-minute intervals. For most metrics, sub-minute granularity provides no additional value. Disk space doesn't change meaningfully in 30 seconds. Interface errors might, but even that's debatable.
Match polling intervals to metric volatility. Bandwidth usage benefits from one-minute checks. CPU and memory? Five minutes suffices for most servers. Disk space? Hourly or even daily polling catches problems long before you run out of space.
Excessive polling floods your database with samples, degrading query performance and ballooning storage requirements. Graph rendering slows down when retrieving millions of data points. Finding meaningful information becomes harder when it's buried in petabytes of largely identical samples.
Baseline establishment takes patience most people don't exercise. You install monitoring today and want immediate value from alerts. So you guess at thresholds, enable everything, and hope for the best. Then you're drowning in false positives because you don't know what normal looks like.
Let monitoring collect data silently for two weeks minimum. Watch the patterns emerge. That server consistently spikes CPU at 6 AM during backups. Network traffic peaks Tuesday mornings when the security system downloads updates. Friday afternoons see bandwidth drops as users leave early.
Armed with baseline knowledge, configure thresholds above normal fluctuations. Now alerts indicate actual anomalies, not routine operations. Your monitoring becomes useful instead of annoying.
Author: Logan Kessler;
Source: baltazor.com
Frequently Asked Questions About Free Network Monitoring Software
Can I trust free network monitoring tools from a security perspective?
Established open-source projects undergo constant security scrutiny from the community—thousands of eyes reviewing code catch vulnerabilities faster than small closed-source teams. Zabbix, Nagios, and similar tools have security track records spanning decades. Freemium products from reputable vendors like Paessler receive professional security audits because their commercial reputation depends on it.
The security risk lies almost entirely in deployment practices, not the software itself. Weak passwords, unpatched systems, and exposing web interfaces to the internet cause breaches—not inherent flaws in the free tools. Treat monitoring infrastructure with the same security rigor as domain controllers or financial systems. Run on isolated management VLANs, enforce strong authentication, patch promptly, and monitor access logs. The software's price tag doesn't determine its security posture—your configuration does.
How do network monitoring and network mapping differ functionally?
Monitoring watches device health continuously—is it responding, what's the CPU usage, how's bandwidth consumption looking? It's operational awareness focused on performance and availability right now, plus historical trending over time. You get alerts when thresholds break and graphs showing how metrics change.
Mapping creates visual topology diagrams showing physical or logical connections between devices. Which switch ports connect to which devices? How's your spanning tree configured? What's the path between two endpoints? Mapping answers architectural questions about how your network fits together, which matters during planning and troubleshooting complex issues.
Many platforms combine both—LibreNMS monitors performance while also generating topology maps from LLDP data. But some tools specialize. Observium excels at monitoring with beautiful graphs but produces mediocre maps. Dedicated mapping tools might create stunning topology diagrams without monitoring capabilities. You ideally want both functions in one platform, but understand they serve different purposes.
What device counts can I actually achieve with free tools?
PRTG's free version explicitly caps at 100 sensors, period. No exceptions, though one device consumes multiple sensors depending on what you monitor. Observium Community Edition maxes out at 250 devices total. Those limits are hard and enforced by the software.
Open-source options like Zabbix, Nagios, and LibreNMS impose no licensing limits whatsoever. Your practical ceiling depends entirely on server hardware and tuning expertise. A properly configured Zabbix server with 16GB RAM and decent storage handles 5,000-10,000 devices comfortably. Increase hardware specs, optimize database queries, and add distributed pollers—now you're monitoring 50,000+ devices. I've personally worked with Zabbix installations exceeding 20,000 devices on modest hardware.
The flip side? Poorly configured open-source tools struggle with 500 devices despite claiming "unlimited" capacity. Database tuning, poller optimization, and housekeeping configuration determine real-world limits. "Unlimited" means no artificial software caps, not infinite magical capacity regardless of hardware.
Do free monitoring platforms run on Linux systems?
Absolutely—most free tools were designed primarily for Linux. Zabbix, Nagios, LibreNMS, and Icinga are all Linux-native applications that perform best on Linux servers. Some offer Windows compatibility as an afterthought, but Linux remains the primary platform.
PRTG is the notable exception, requiring Windows Server for the monitoring platform itself (though it monitors Linux devices without issues). Spiceworks runs on Windows as well.
Linux-based monitoring tools typically outperform Windows equivalents in resource efficiency and scaling capacity. A Linux server with 8GB RAM can monitor more devices than a similarly-specced Windows server due to lower OS overhead. If your organization already runs Linux infrastructure, you'll find more free monitoring options with better performance than Windows-only shops.
Container deployments blur OS lines somewhat. Run Zabbix or Icinga in Docker containers on any system supporting Docker—Linux, Windows, or macOS. This simplifies installation and updates while maintaining platform flexibility.
What happens if I outgrow free versions—can I upgrade smoothly?
Upgrade paths vary dramatically by tool. PRTG makes this absolutely seamless—purchase a license, enter the activation key in your existing installation, and instantly monitor more sensors. Your configuration, historical data, and dashboards remain unchanged. You're literally buying more capacity in the same platform you're already using.
Nagios Core users can upgrade to Nagios XI (the commercial version), though configuration migration requires effort. The underlying monitoring engine stays similar, but XI adds a modern web interface and additional features. You'll spend time porting configs, not starting from scratch.
Open-source tools like Zabbix remain completely free forever at any scale. There's no paid version to upgrade to—the same software monitors 100 or 100,000 devices. What you might purchase eventually is commercial support contracts, training, or consulting services. The software itself stays free.
Spiceworks presents a unique case—it doesn't offer paid upgrades because the free product is monetized through advertising. If Spiceworks doesn't meet your needs, you're migrating to an entirely different platform, not upgrading within the same ecosystem.
Check upgrade options before investing months configuring a platform. If you'll likely outgrow free limitations, choose tools with clear commercial paths. If you're committed to free forever, pick platforms without artificial caps from day one.
Which protocols do free network discovery tools actually support?
SNMP support is universal—v1, v2c, and v3 all work in every serious free monitoring tool. ICMP (ping) is equally ubiquitous. WMI for Windows monitoring appears in all mainstream platforms. SSH for agentless Linux/Unix monitoring is standard. Those four protocols cover 90% of typical monitoring needs.
NetFlow, sFlow, and IPFIX for traffic analysis appear in most tools, though implementation quality varies. PRTG and LibreNMS handle flows well. Nagios requires plugins that range from excellent to barely functional. Bandwidth monitoring depth separates basic from advanced free tools.
IPMI for hardware sensor monitoring (temperatures, voltages, fan speeds) works in platforms targeting server monitoring. Check-based systems like Nagios support IPMI through plugins. SNMP-based systems often poll IPMI via SNMP translators.
Specialized protocols depend on specific tools and available plugins. Modbus for industrial equipment? Nagios has plugins, others don't. MQTT for IoT devices? You'll need custom integration or specialized monitoring platforms. REST APIs for cloud services? Varies widely—some tools integrate easily, others require scripting.
Before committing to a platform, verify it supports protocols your specific environment uses. Generic "network monitoring" capabilities don't guarantee your legacy serial-to-ethernet converters or obscure lab equipment will work. Check documentation and community forums for your exact devices.
Free network monitoring software delivers legitimate value when you match the right tool to your network size and team skills. These platforms power everything from home labs to mid-sized corporate networks—proof you don't need enterprise budgets for effective monitoring.
Success depends on understanding limitations upfront. Device caps, support gaps, and feature restrictions are real. But knowing those constraints lets you work within them instead of discovering them during an outage.
Start simple if you're new to monitoring. PRTG's free tier or Spiceworks get you running quickly without overwhelming complexity. Build experience with device monitoring and basic alerting. Once comfortable, graduate to Zabbix or Nagios for unlimited scaling and deeper capabilities.
The specific tool matters less than using it consistently. Simple monitoring you check daily beats sophisticated platforms you ignore. Configure alerts that matter, document your setup, keep software updated. Your free network monitor becomes genuinely valuable infrastructure when you treat it seriously.
None of these tools solve every problem perfectly. You'll hit device caps or miss features eventually. That's fine—migration paths exist when you outgrow free versions. What matters now is getting visibility into your network without breaking the budget.
Pick a tool, install it this week, and start monitoring your critical gear. You'll catch problems before users notice them, which is the whole point
A software defined network (SDN) separates control intelligence from physical equipment, enabling centralized management and programmable network behavior. Discover the three-layer architecture, key components, and how SDN transforms enterprise networking
A complete guide to setting up an intranet for your organization. Covers planning requirements, choosing between cloud and self-hosted platforms, technical setup steps, common mistakes to avoid, and strategies for maintaining and scaling your intranet over time
Remote desktop hosting delivers centralized desktop environments accessible from anywhere. This guide covers infrastructure selection, security implementation with multi-factor authentication and VPN, printing solutions, and common pitfalls to avoid when deploying remote desktop services for your business
Private cloud infrastructure dedicates computing resources to a single organization, offering control and compliance advantages over shared public cloud. This guide examines architecture, platform choices, managed services options, and decision criteria for enterprises evaluating private cloud deployment
The content on this website is provided for general informational and educational purposes only. It is intended to explain concepts related to cloud computing, computer networking, infrastructure, and modern IT systems.
All information on this website, including articles, guides, and examples, is presented for general educational purposes. Technology implementations may vary depending on specific environments, business needs, infrastructure design, and technical requirements.
This website does not provide professional IT, engineering, or technical advice, and the information presented should not be used as a substitute for consultation with qualified IT professionals.
The website and its authors are not responsible for any errors or omissions, or for any outcomes resulting from decisions made based on the information provided on this website.