Top-down view of a modern server room with neatly organized server racks illuminated by blue and green LED lights and color-coded network cables in cable trays
Ever walked into a server room and wondered how everything connects? Or spent three hours at midnight trying to figure out why the accounting department can't reach the file server? That's network topology at work—or not working, as the case may be.
How your network devices link together determines whether you'll spend your days proactively managing infrastructure or reactively fighting fires. Get the structure right, and you've got room to grow. Get it wrong, and you're stuck explaining to executives why simple changes take weeks and cost thousands.
What Is Network Topology?
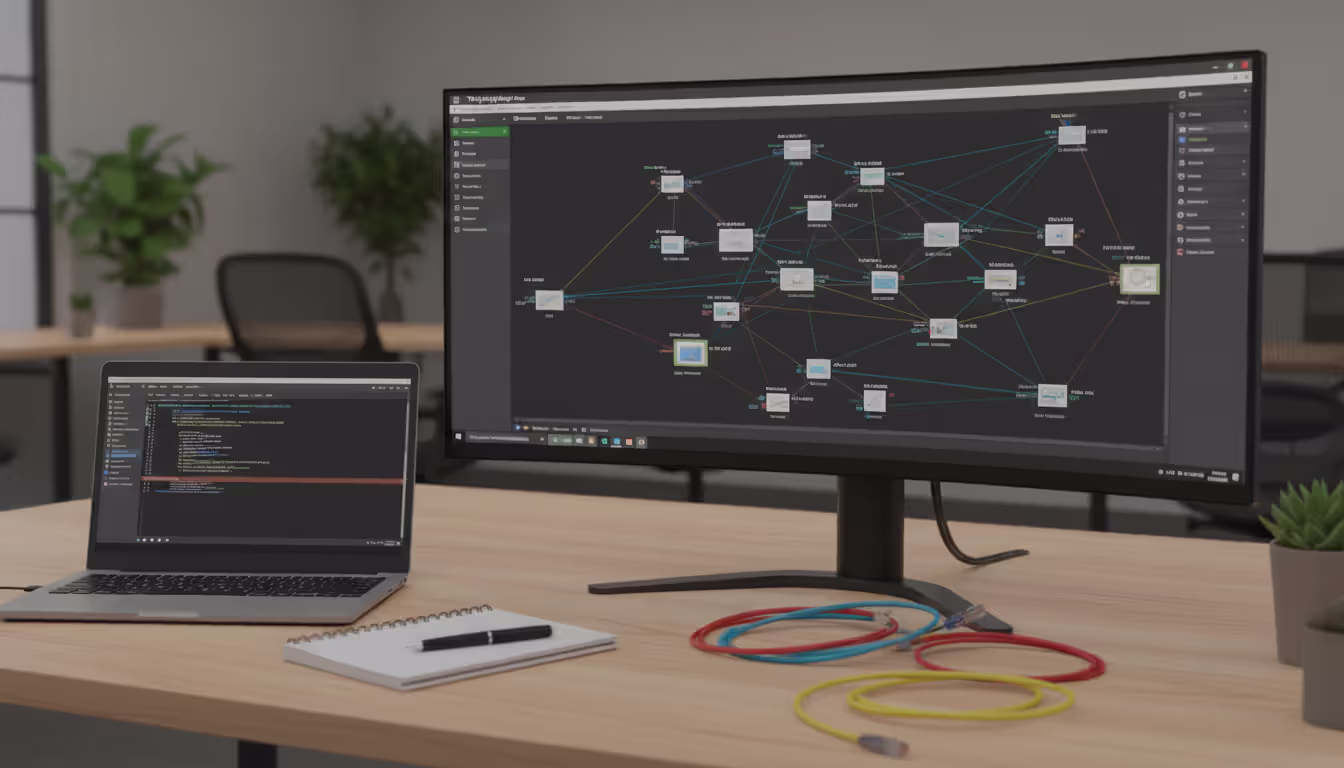
Here's what network topology actually means: it's the pattern that emerges when you map out how your switches, routers, servers, and endpoints interconnect. Imagine drawing lines between every piece of equipment that talks to each other. That drawing? That's your topology.
Now here's where it gets interesting—you've actually got two different maps of the same network. The physical side shows tangible stuff: which Ethernet cables run through your ceiling, where the patch panels live in each closet, what physically plugs into what. Go to your wiring closet right now and trace a cable from port to device—that's physical topology in action.
The logical side tells a different story. It shows how information actually moves, which might surprise you. I've seen networks where devices sitting three feet apart physically send data through five different switches because of VLAN configuration. The packets take a completely different journey than the cables would suggest.
This matters more than you'd think. Last month, I spent four hours troubleshooting what looked like a routing problem. Turned out a junior tech had patched cables following the physical layout without checking the logical configuration. Created a switching loop that brought down an entire floor.
Performance lives or dies by these choices. Bad topology design creates unnecessary hops—your data bouncing through three extra switches just to reach a server on the same rack. Each hop adds latency, maybe just 2-3 milliseconds, but it accumulates. For real-time applications or high-frequency trading environments, those milliseconds cost money.
Author: Logan Kessler;
Source: baltazor.com
Then there's troubleshooting at 3 AM when production is down. Without clear topology maps—both physical and logical—you're guessing. Which device failed? What else depends on it? Where can traffic reroute? I've watched engineers waste 45 minutes checking perfectly good equipment because nobody documented that a critical switch had been moved during a refresh project.
Common Types of Network Topology
Real networks mix and match these patterns, but understanding each type helps you make smarter design decisions.
Bus Topology connects everything to one main cable running through your space. Think of it like an old-school phone party line—everyone shares the same wire. Early 10BASE2 Ethernet worked this way, with coaxial cable and T-connectors at each station.
The problems? One break anywhere kills the entire network. Performance tanks as you add devices because they're all competing for the same bandwidth, creating collisions. Plus, troubleshooting means physically checking every connection point along the cable run. I haven't seen bus topology in production since the late 1990s, and there's good reason. Only use this for temporary lab setups where simplicity matters more than reliability.
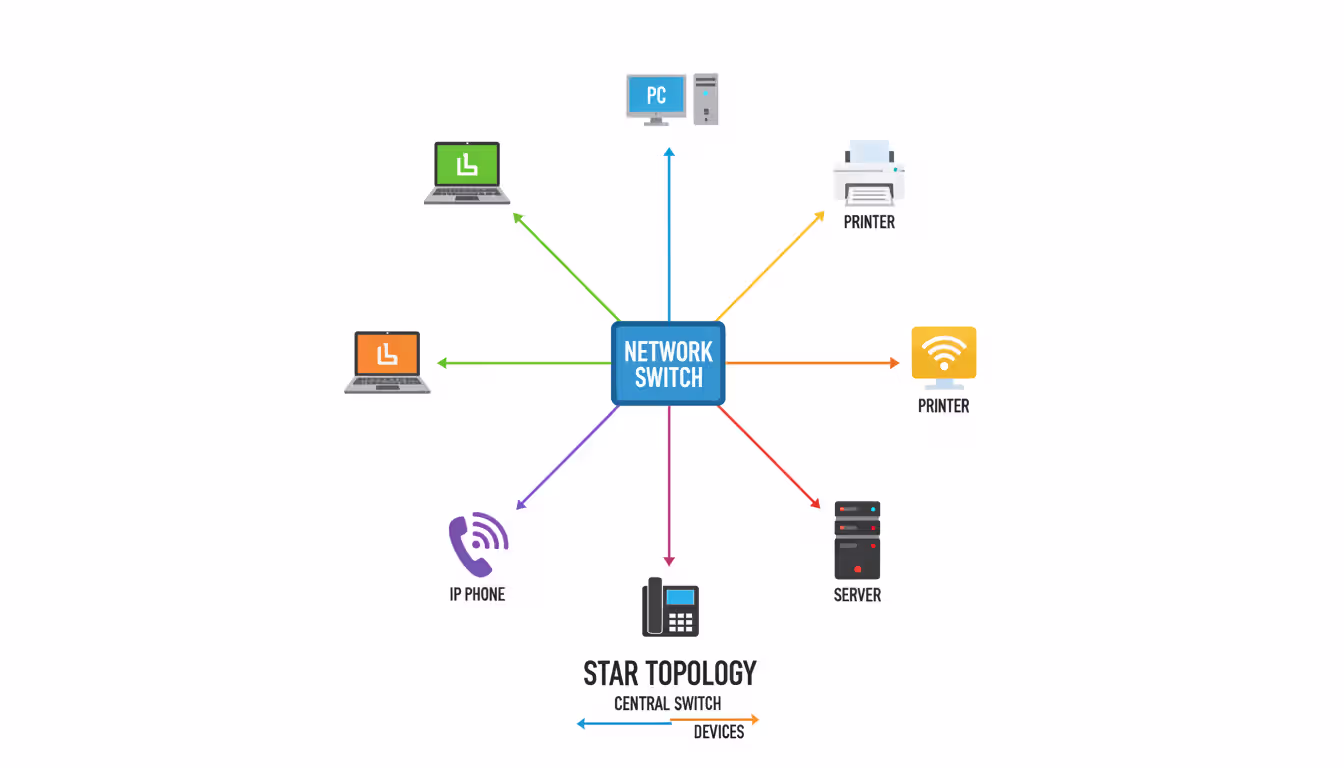
Star Topology puts a switch or hub at the center with dedicated cables radiating outward to each device. Walk into any modern office and you'll find star topology—every desk connects back to a wiring closet switch.
The advantages are obvious: one cable failure affects just one device, not everybody. Troubleshooting becomes straightforward—is it the device, the cable, or the switch port? You can test each independently. Adding new devices means running a cable and plugging in, no disruption to existing connections.
The catch? Your central switch becomes critical infrastructure. When it dies, everything connected goes dark. I learned this the hard way during a power surge that took out a department switch. Thirty people sat idle for two hours while we swapped hardware. Now I budget for redundant switches with failover capabilities in critical areas. Star topology scales well up to the port count of your switches, then you start needing multiple switches and thinking about tree topology.
Author: Logan Kessler;
Source: baltazor.com
Ring Topology chains devices in a loop, with data traveling clockwise or counterclockwise around the circle. Token Ring networks from the 1980s and 90s used this approach. Each device receives the data packet, checks if it's the intended recipient, then passes it along to the next station.
Predictable performance is the main benefit—every device gets equal access using a token-passing system, so nobody monopolizes bandwidth. Dual-ring configurations add fault tolerance by running two counter-rotating rings. If one breaks, traffic automatically switches to the other direction.
But ring topology creates operational headaches. Adding or removing a device temporarily breaks the ring. A single cable break in a simple ring topology segments your network into two pieces that can't communicate. FDDI implementations solved some of these problems with dual rings and self-healing capabilities, but ring topology has mostly faded from LANs. Some metro area networks still use it for provider backbone connections where the reliability characteristics make sense.
Mesh Topology directly interconnects devices without requiring traffic to pass through intermediaries. Full mesh means every device connects to every other device—wildly redundant but expensive. With ten devices, you'd need forty-five separate connections. Partial mesh selectively connects critical devices while leaving less important ones to connect through intermediaries.
The reliability is unmatched. Traffic automatically routes around failures using alternative paths. No single connection failure brings anything down. Data centers use mesh topology connecting core routers, giving multiple paths between any two points.
The cost and complexity, though—full mesh only makes sense for small numbers of critical devices. Managing a full mesh with fifty devices would require 1,225 connections, which is obviously impractical. Partial mesh offers a middle ground: connect your core infrastructure in a mesh for redundancy, while edge devices use simpler star topology connections. Wireless mesh networks for city-wide WiFi or rural internet access use this principle, with strategically placed nodes creating overlapping coverage.
Tree Topology resembles an organizational chart—multiple star networks connecting upward to a backbone. Each branch office might have its own switch (star topology locally), with all branches connecting to headquarters through a higher-tier switch or router.
This mirrors how many businesses actually organize. The Dallas office has 30 employees on one switch, Austin has 20 on another, and both connect to Houston headquarters. Traffic within each office stays local. Inter-office traffic flows up to the backbone and back down.
Tree topology scales beautifully because you add branches without redesigning the core. It also segments traffic naturally—broadcast storms in one branch don't flood the entire organization. The downside is that failures higher in the tree affect everything downstream. If the root switch dies, all branches lose connectivity to each other. Design the top of the tree with redundancy: dual core switches, redundant backbone links, backup power.
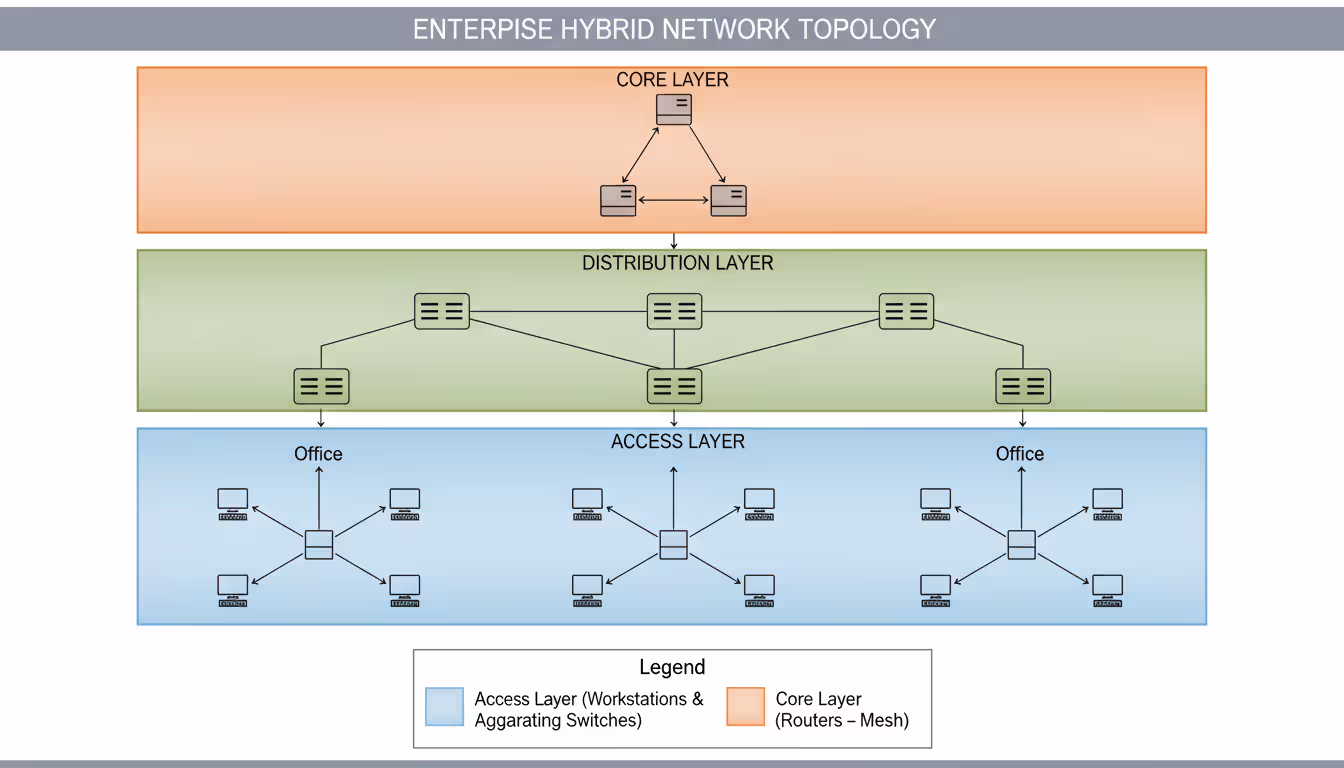
Hybrid Topology combines multiple types strategically. This is what you'll actually implement in real environments. Maybe star topology within each floor, tree topology connecting floors within a building, mesh topology linking your core data center switches, and fiber rings connecting buildings on a campus.
Hybrid approaches let you optimize each segment. Use affordable star topology where it works, add expensive mesh where reliability justifies the cost, implement tree structure where your physical locations naturally support it. The challenge is documentation—you need to clearly map how different segments interconnect and understand the dependencies. What looks like redundant paths might actually converge at a single point somewhere in the hybrid topology.
Author: Logan Kessler;
Source: baltazor.com
When to Use Each Topology Type
Match topology to requirements, not the other way around.
Star topology handles 90% of local area networks. Use it for office spaces, retail locations, small warehouses—anywhere you've got endpoints connecting to central infrastructure. A quality 48-port switch costs $800-2000 and handles most small business needs. Star topology makes sense until you exceed switch capacity or geographic distance limitations.
Mesh topology justifies its cost for mission-critical links. Connect your primary and disaster recovery data centers with mesh. Link core distribution switches with mesh. Create wireless mesh networks for large facilities where running cables is impractical. Partial mesh gives redundancy without ridiculous cable counts—maybe connect your three main distribution switches in a triangle, providing two paths between any pair.
Tree topology fits organizations with branches, departments, or buildings. University campuses use tree topology with excellent results—each building has local switches (stars) connecting to distribution switches, which link to a core network at the data center. Tree topology also works for manufacturers with multiple production floors or retailers with numerous locations.
Hybrid topology becomes inevitable as you scale beyond fifty devices or multiple locations. You'll combine star for endpoint connectivity, tree for organizational structure, and mesh for critical core infrastructure. Design each segment for its specific needs. A warehouse might need ruggedized switches and longer cable runs, while executive offices need higher bandwidth and lower latency.
Skip bus and ring topologies unless you're maintaining legacy equipment or have truly unusual requirements. Modern switched Ethernet using star or tree topologies outperforms both in reliability, speed, and manageability.
How to Read a Network Topology Diagram
Diagrams use visual shorthand to represent complex networks. The symbols aren't rigidly standardized, but conventions exist across the industry.
Device icons identify equipment types at a glance. Routers usually appear as cylinders with arrows suggesting routing functions, or boxes with interconnected arrows. Switches show up as rectangular boxes, sometimes with arrows indicating multiple ports. Servers might be drawn as tower computers or rack-mounted units. Firewalls often incorporate flame or shield imagery. WiFi access points typically show radio waves emanating outward. Cloud services appear as—surprise—clouds.
Different tools use varying icon sets, so check the diagram legend. Some organizations create custom icons for specialized equipment like industrial controllers or IP cameras.
Connection lines map the cables and wireless links. Solid lines typically represent physical Ethernet connections. Dashed lines might indicate wireless links, backup paths, or logical connections that don't correspond to physical cables. Some diagrams use line thickness to show bandwidth—a fat line for 10Gbps fiber trunks, thinner lines for 1Gbps connections.
Colors often encode information. Green might indicate active links, red for failed connections, yellow for degraded performance. Sometimes colors represent different VLANs, network segments, or security zones. Always check the legend—color schemes vary by organization and tool.
Labels pack critical details directly onto the diagram. Look for IP addresses next to devices, interface identifiers like "Gi1/0/24" showing which physical port makes each connection, VLAN tags indicating logical network segmentation, and link speeds like "1000Mbps" or "10G". Well-labeled diagrams also include device hostnames, making it easy to find the right switch when you need to log in for changes.
Visual grouping uses boxes, shading, or positioning to show logical or physical boundaries. A shaded rectangle might represent a single subnet, a particular VLAN, a physical location like "Building 3, Floor 2", or a security zone like the DMZ. These boundaries indicate where traffic policies change, routing decisions occur, or security controls apply.
When analyzing an unfamiliar diagram, start by identifying internet connections and core infrastructure. Follow paths from user devices back through access switches, distribution switches, core routers, and out to internet links. Notice where redundant paths exist—multiple routes between critical devices provide fault tolerance. Identify single points of failure where no alternative path exists, because those are your vulnerabilities.
Check for logical consistency in naming and numbering. Professional diagrams follow patterns: sequential IP addresses, systematic hostnames, consistent VLAN numbering. Random patterns suggest the network grew organically without planning—a warning sign for potential problems.
Creating Network Topology Diagrams
Accurate documentation requires systematic work, not just sketching from memory.
Step 1: Catalog everything. Walk the physical network if you can. Document routers, switches, firewalls, servers, access points, and significant workstations. Record manufacturer and model, hostname, management IP address, physical location ("Building A, Wiring Closet 3rd Floor"), and serial numbers for warranty tracking. Include supposedly minor devices—IP-based security cameras, VoIP phones, print servers, building automation controllers. They're all nodes in your topology.
Use a spreadsheet initially. You'll organize this data into a proper database or DCIM tool later, but start by getting everything written down. Take photos of equipment labels and cable connections.
Step 2: Map connections. For each device, document what plugs into each port. If you've got a 48-port switch, that's potentially 48 connections to identify. Note cable types—Cat5e, Cat6, Cat6a, single-mode fiber, multimode fiber. Record link speeds and whether connections are active production links or standby failover paths.
Check switch configurations to verify VLANs and port settings. The physical patch might look simple, but VLAN configuration determines logical topology. Use network discovery tools to verify your manual documentation, but don't trust automation completely. Tools miss devices with SNMP disabled, non-IP equipment, and air-gapped segments.
Step 3: Document logical segmentation. Identify every subnet, VLAN, security zone, and routing domain. Understanding logical topology matters as much as physical cables. Map out routing protocols—OSPF, EIGRP, BGP, or static routes. How does traffic actually flow between segments? Where do ACLs or firewall rules restrict communication?
This logical mapping often reveals surprises. I once documented a network where the previous administrator had created 47 VLANs but only 12 subnets were actually in use. The rest were abandoned configurations nobody had cleaned up, creating confusion and security risks.
Step 4: Select diagramming tools. Small networks under fifty devices work fine with manual diagramming. Microsoft Visio costs about $300 for a standalone license. Lucidchart runs $7-9 monthly per user for cloud-based diagramming. Draw.io offers completely free diagramming through your web browser.
Larger networks benefit from automated discovery. These tools scan using SNMP, CDP, LLDP, and other protocols to build topology maps from actual device data. They cost more—hundreds to thousands annually—but save enormous time and maintain accuracy automatically.
Many organizations use hybrid approaches: automated discovery generates initial diagrams, then manually refine them for clarity and add contextual information automation can't capture.
Step 5: Build the diagrams. Start with high-level overview diagrams showing major segments and how they interconnect. Create detailed diagrams for each segment, location, or functional area. Maintain consistent symbol sets and labeling conventions throughout all diagrams.
Include a legend explaining symbols, colors, line styles, and any abbreviations. Future you—or your replacement—will appreciate this when referencing diagrams six months later.
Layer your diagrams by detail level. Create a one-page overview showing the big picture. Create detailed views drilling down into specific areas. Link them together so viewers can zoom in and out conceptually.
Author: Logan Kessler;
Source: baltazor.com
Step 6: Add supporting documentation. Diagrams alone don't capture everything you need. Add notes about configuration specifics, maintenance history, known issues, and planned changes. Document vendor contact information, support contract numbers, and emergency procedures.
Store diagrams in accessible locations with proper version control. Networks change constantly, and you need to track those changes over time. Cloud storage with automatic versioning works well—Sharepoint, Google Drive, or specialized DCIM platforms.
Step 7: Verify accuracy. Have a colleague review your diagrams against the actual network. Better yet, use the diagrams to trace traffic paths for common scenarios. Can you map the path from a user's workstation to the internet? From one branch office to another? During a hypothetical failure of a core switch, can you identify which segments lose connectivity and what alternative paths exist?
Inaccurate documentation is worse than no documentation—it misleads troubleshooting and causes wrong decisions during changes.
Network Topology Mapping Tools Comparison
Tool selection depends on network size, complexity, budget, and whether you need one-time documentation or ongoing automated updates.
Free versus paid options: Free tools like draw.io, LibreOffice Draw, and Dia handle basic manual diagram creation. They cost nothing but require building everything by hand. You're trading time for money.
Paid tools range from affordable SaaS subscriptions around $10-50 monthly to enterprise platforms costing $5,000-50,000+ annually. They typically provide automated discovery, real-time updates, integration with monitoring systems, and collaboration features. Whether the cost justifies benefits depends on your network scale and how much you value time savings.
Automated versus manual discovery: Automated tools scan your network using SNMP polling, CDP queries, LLDP data, ARP tables, and routing table analysis to discover devices and connections. This works incredibly well for networks with hundreds or thousands of devices where manual mapping would take weeks.
Manual tools require drawing everything yourself, which takes longer but gives complete control over presentation and layout. You can emphasize what matters and de-emphasize less important connections for clearer communication.
Most organizations benefit from combined approaches: automated discovery for the initial map and ongoing accuracy, manual refinement for clarity and annotations.
Cloud versus desktop applications: Cloud-based tools let distributed teams access and update diagrams from anywhere. They include collaboration features, automatic backups, and no software installation. The tradeoff is ongoing subscription costs and dependency on internet connectivity.
Desktop applications run locally, giving complete control over data security and working offline. They typically involve upfront licensing costs rather than subscriptions. The disadvantage is that collaboration requires manually sharing files, and accessing diagrams remotely requires VPN or similar solutions.
Tool categories worth considering:
Network mapping platforms like SolarWinds Network Topology Mapper or ManageEngine OpManager automatically discover and map infrastructure using multiple protocols. They update diagrams continuously as your network evolves and integrate with monitoring platforms to show performance alongside topology. These suit mid-size to large enterprises with hundreds of devices and frequent changes.
General diagramming tools like Lucidchart, Microsoft Visio, or OmniGraffle focus on creating professional visualizations manually or by importing data from discovery tools. They offer extensive symbol libraries, templates, and presentation features. These work well for smaller networks or when you need publication-quality diagrams for documentation or presentations.
Open-source options like Netdisco, NetBox, or OpenNMS provide discovery and documentation without licensing fees. They require technical expertise to deploy and maintain but offer flexibility and active community support. These appeal to organizations with strong internal technical teams or budget constraints.
Integrated monitoring platforms like Auvik, Datadog NPM, or PRTG Network Monitor combine topology mapping with real-time performance monitoring. They show not just network structure but current bandwidth utilization, error rates, and availability. These suit managed service providers or organizations needing unified visibility into infrastructure.
When evaluating tools, ask: Does it support your equipment vendors? Cisco gear is widely supported, but if you're running HPE, Aruba, Juniper, or Ubiquiti, verify compatibility. Can it handle your network size? Some tools perform poorly beyond certain device counts. Does it integrate with existing monitoring and management tools? What's the learning curve—will your team actually use it? How frequently does it update topology data? What's the total cost including training, support, and ongoing maintenance?
Network Topology Planning Mistakes to Avoid
The biggest mistake organizations make is treating network topology as a one-time decision rather than an evolving architecture. Your topology should adapt as your business changes, and that requires ongoing documentation and periodic review. I've seen companies spend millions on network upgrades that wouldn't have been necessary if they'd planned topology with growth in mind from the start
— Jennifer Martinez
Common mistakes create expensive problems that could have been easily prevented during initial design.
Ignoring growth and scalability ranks as the most expensive mistake. You design for today's 25 employees, but next quarter you're adding 15 more. That 48-port switch suddenly doesn't have enough ports. The internet connection that seemed adequate now creates bottlenecks during peak usage.
Plan for at least 30% growth over your equipment refresh cycle. If you're keeping switches for five years, design for five years of business growth. Budget for spare ports, extra bandwidth capacity, and additional capacity in core infrastructure. Redesigning inadequate topology costs far more than building headroom initially. I've seen organizations spend $50,000 reworking network infrastructure that could have been designed right for an extra $8,000 upfront.
Inadequate documentation seems like a time-saver during implementation but becomes a nightmare later. Undocumented networks force reverse-engineering during outages. I've watched panicked engineers at 2 AM trying to figure out which devices depend on a failed switch, wasting precious recovery time.
Create diagrams during installation, not after the fact. You'll forget details within days. Update documentation immediately when making changes—you won't remember specifics weeks later when someone asks. Include not just diagrams but also configuration notes, IP assignments, VLAN purposes, vendor contacts, and troubleshooting procedures.
Skipping redundancy creates single points of failure. Redundant components cost more initially, but calculate downtime costs. If your e-commerce business loses $10,000 per hour during outages, spending $3,000 on backup internet connectivity suddenly seems cheap.
Critical paths need backup options: redundant links between core switches, multiple internet connections with automatic failover, backup power supplies in critical equipment, alternative paths for essential traffic. Balance redundancy investment against actual business impact of failures. A small retail shop might accept some risk; a hospital cannot.
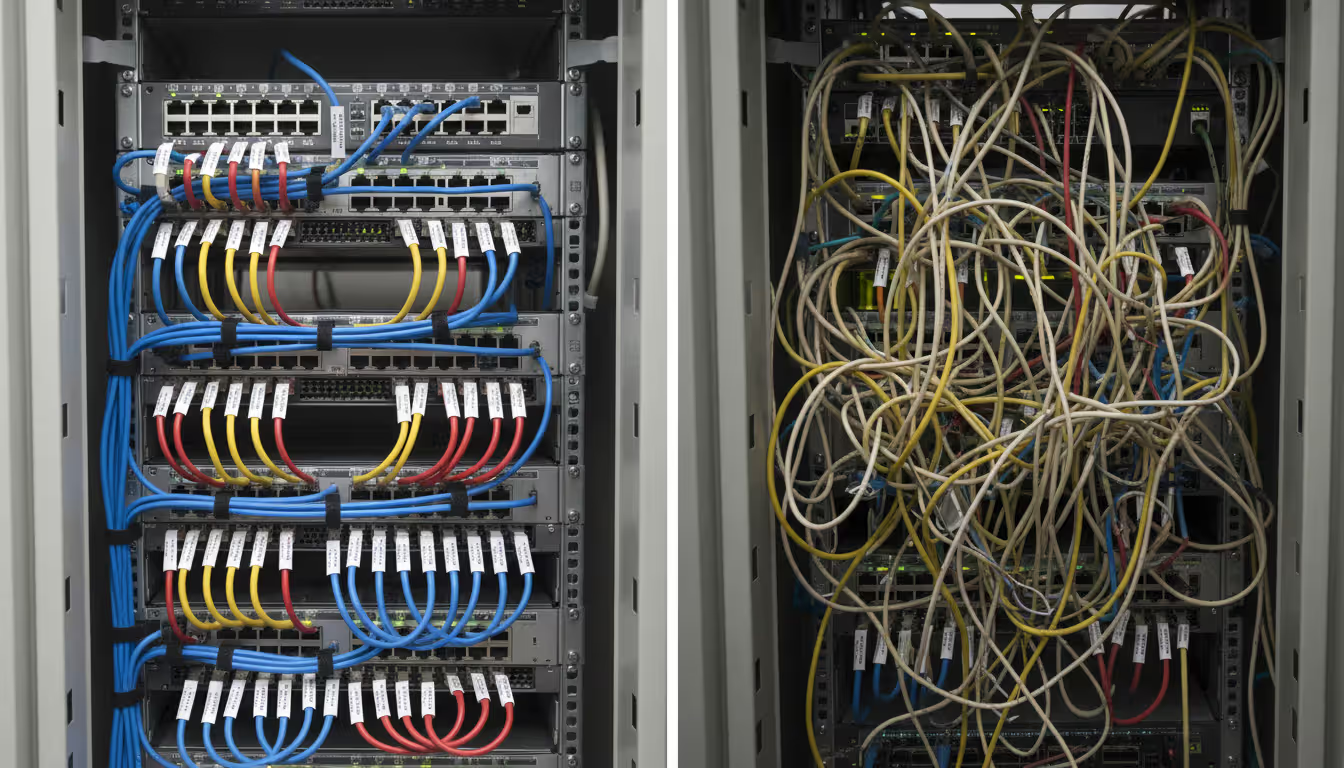
Cable management disasters seem minor until you need to trace a problem or make changes. Poorly organized cable runs make changes risky—you might accidentally disconnect the wrong device. Unlabeled cables waste hours during troubleshooting as you tone cables to identify endpoints.
Implement proper cable management from day one: label both ends of every cable with clear identifiers, use cable trays and management panels in racks, maintain separation between power and data cables to prevent interference, document cable runs in topology diagrams with physical routing information. Color-coding helps—blue for regular data, yellow for cross-connects, red for critical infrastructure.
Author: Logan Kessler;
Source: baltazor.com
Underestimating bandwidth requirements creates bottlenecks that throttle performance. That 1Gbps uplink to your core switch works fine initially, then everyone starts streaming music and backing up to cloud storage simultaneously. Suddenly you've got congestion.
Calculate aggregate bandwidth needs, not just individual device requirements. Twenty-four devices with 1Gbps connections don't each get 1Gbps all the time—they share uplink capacity. Consider traffic patterns: when do peak loads occur? Where does most traffic flow? Oversubscription ratios matter. Connecting twenty-four 1Gbps devices to a switch with only two 1Gbps uplinks creates 12:1 oversubscription. Under heavy load, devices will compete for insufficient uplink capacity, causing delays.
Combining management and user traffic creates security and reliability risks. When management interfaces for switches and routers share the same network segments as user devices, users can potentially access management interfaces (security risk), and network problems preventing user traffic also prevent managing infrastructure to fix those problems.
Separate management traffic onto dedicated VLANs or out-of-band management networks. This prevents unauthorized access to administrative interfaces and ensures you can still manage devices during network issues affecting user traffic.
Neglecting physical security leaves infrastructure vulnerable. Unlocked wiring closets let anyone plug unauthorized devices into your network or disconnect critical cables. Unsecured wireless access points can be stolen or tampered with. Physical access frequently bypasses logical security controls—an attacker with physical access can often compromise networks despite strong passwords and firewalls.
Secure infrastructure locations with locks, use lockable equipment racks, implement port security on switches to prevent unauthorized device connections, and monitor access to critical infrastructure spaces.
Topology Type
Cost
Scalability
Fault Tolerance
Best Use Case
Complexity
Bus
Very Low
Poor - adding devices degrades performance
Very Low - one break kills everything
Temporary lab setups only
Very Low
Star
Low-Medium
Good - limited by switch port count
Medium - central device is single point of failure
Office LANs, departmental networks
Low
Ring
Medium
Medium - adding devices requires reconfiguration
Medium-High with dual ring implementation
Provider backbones, legacy environments
Medium
Mesh (Full)
Very High
Poor - connections scale exponentially
Very High - multiple paths between all devices
Critical links between small device counts
Very High
Mesh (Partial)
Medium-High
Good - strategic redundancy
High - redundant paths for critical links
Data center core infrastructure
High
Tree
Medium
Excellent - branch structure scales naturally
Medium - root failure affects everything downstream
Campus networks, multi-site organizations
Medium
Hybrid
Variable by segment
Excellent - optimize each segment independently
Variable - design specific to requirements
Large complex networks, most real-world environments
High
FAQ About Network Topology
What is the difference between physical and logical network topology?
Physical topology maps the tangible infrastructure—where cables actually run, how devices physically connect, which port plugs into which equipment. Walk through your server room tracing cables and you're exploring physical topology. Logical topology describes how data actually moves through your network regardless of physical connections. VLANs create logical segmentation that doesn't match physical cable runs. A device might be physically connected to Switch A but logically belong to a subnet that routes through Switch B. Both perspectives matter for different reasons: physical topology helps with installation planning and troubleshooting hardware failures, while logical topology matters for understanding traffic flow, performance optimization, and security boundaries.
Which network topology is most reliable?
Full mesh topology provides maximum reliability because every device directly connects to every other device—multiple paths exist between any two points. However, full mesh quickly becomes impractical due to connection count (ten devices require 45 connections; 20 devices need 190 connections). For real-world reliability, partial mesh connecting critical infrastructure elements offers excellent fault tolerance without excessive cost. Star topology with redundant central switches also provides good reliability for most business needs. The "most reliable" topology depends on your specific requirements, budget constraints, and which components are actually critical to operations. A financial trading firm might justify full mesh between core systems; a small medical office might use dual internet connections with star topology internally.
Do I need special software to create a network topology diagram?
Basic network topology diagrams can be created using general drawing programs like Microsoft Visio, Lucidchart, draw.io (completely free), or even PowerPoint if you're desperate. These work adequately for small networks with 20-30 devices or initial documentation projects. However, specialized network mapping software becomes worthwhile for larger or frequently-changing networks. These tools automatically discover devices and connections using SNMP, CDP, LLDP, and other network protocols, saving significant time and improving accuracy. They also keep diagrams updated as your network evolves. For networks exceeding 50 devices or environments with regular changes, specialized software typically pays for itself through time savings and reduced documentation errors within the first year.
How often should I update my network topology documentation?
Update topology documentation immediately every time you make changes—adding devices, modifying connections, changing configurations, or decommissioning equipment. Waiting to update documentation means forgetting important details and diagrams becoming inaccurate. Beyond immediate change-driven updates, conduct comprehensive topology reviews quarterly or semi-annually. These periodic reviews catch undocumented changes (someone "temporarily" patched something that became permanent), verify ongoing accuracy, and ensure documentation remains useful for current needs. For networks using automated discovery tools, configure daily or weekly updates. Outdated topology documentation often causes more problems than having no documentation because it misleads troubleshooting efforts and results in incorrect decisions during upgrades or incident response.
What's the best network topology for small businesses?
Star topology works best for most small businesses with 10-100 employees. It's cost-effective (quality switches cost $800-2,000 for 48 ports), easy for technicians to understand and troubleshoot, and scales reasonably well as you grow. Connect all devices—workstations, printers, access points—to central switches, which then connect to your router and firewall for internet access. For businesses where uptime is critical (medical offices, e-commerce, financial services), add a second switch for redundancy and dual internet connections. As you grow beyond 50-100 devices or add multiple locations, transition toward tree topology with star configurations at each location connecting back to central core infrastructure. Avoid bus and ring topologies—they offer no practical advantages for modern small business networks and create unnecessary complexity.
Can network topology affect internet speed?
Network topology significantly impacts your perceived internet performance, though it's technically affecting internal network performance rather than your actual internet connection bandwidth. Poor topology design creates unnecessary hops between your device and the internet gateway, with each hop adding latency (typically 2-5 milliseconds per hop). If traffic must traverse multiple switches or routers due to inefficient topology, delays accumulate noticeably. Bottlenecks occur when topology forces high-bandwidth traffic through low-capacity links—like pushing 500Mbps of internet traffic through a 100Mbps inter-switch connection because of poor design. Well-designed topology minimizes hops between endpoints and internet connections, provides adequate bandwidth on all links, and prevents any single link from becoming a chokepoint. Star or tree topology with appropriately sized switches typically delivers optimal performance for internet access and internal applications.
Network topology forms the structural foundation determining whether your infrastructure supports business operations smoothly or constantly creates problems. Understanding physical versus logical topology, selecting appropriate patterns for specific requirements, and maintaining accurate documentation separates functional networks from problematic ones.
The topology types covered—bus, star, ring, mesh, tree, and hybrid—each offer distinct characteristics suited to different scenarios. Most modern networks implement star topology for endpoint connectivity while incorporating hybrid approaches with mesh or tree elements for redundancy and scalability where justified by requirements and budget.
Don't treat topology as a one-time decision during initial implementation. Networks evolve as organizations grow, applications change, and technology advances. Your topology should adapt accordingly.
Creating and maintaining accurate topology diagrams requires systematic inventory processes, documentation discipline, and appropriate tooling matched to your environment. Whether you use free drawing software or enterprise-grade mapping platforms, the critical factor is keeping documentation current and accessible to everyone who needs it.
Plan for realistic growth projections, build redundancy into critical paths, document thoroughly from the start, and review regularly. These practices prevent common mistakes that create expensive problems later requiring significant rework. Your network topology should enable business objectives, not constrain them through poor planning or execution.
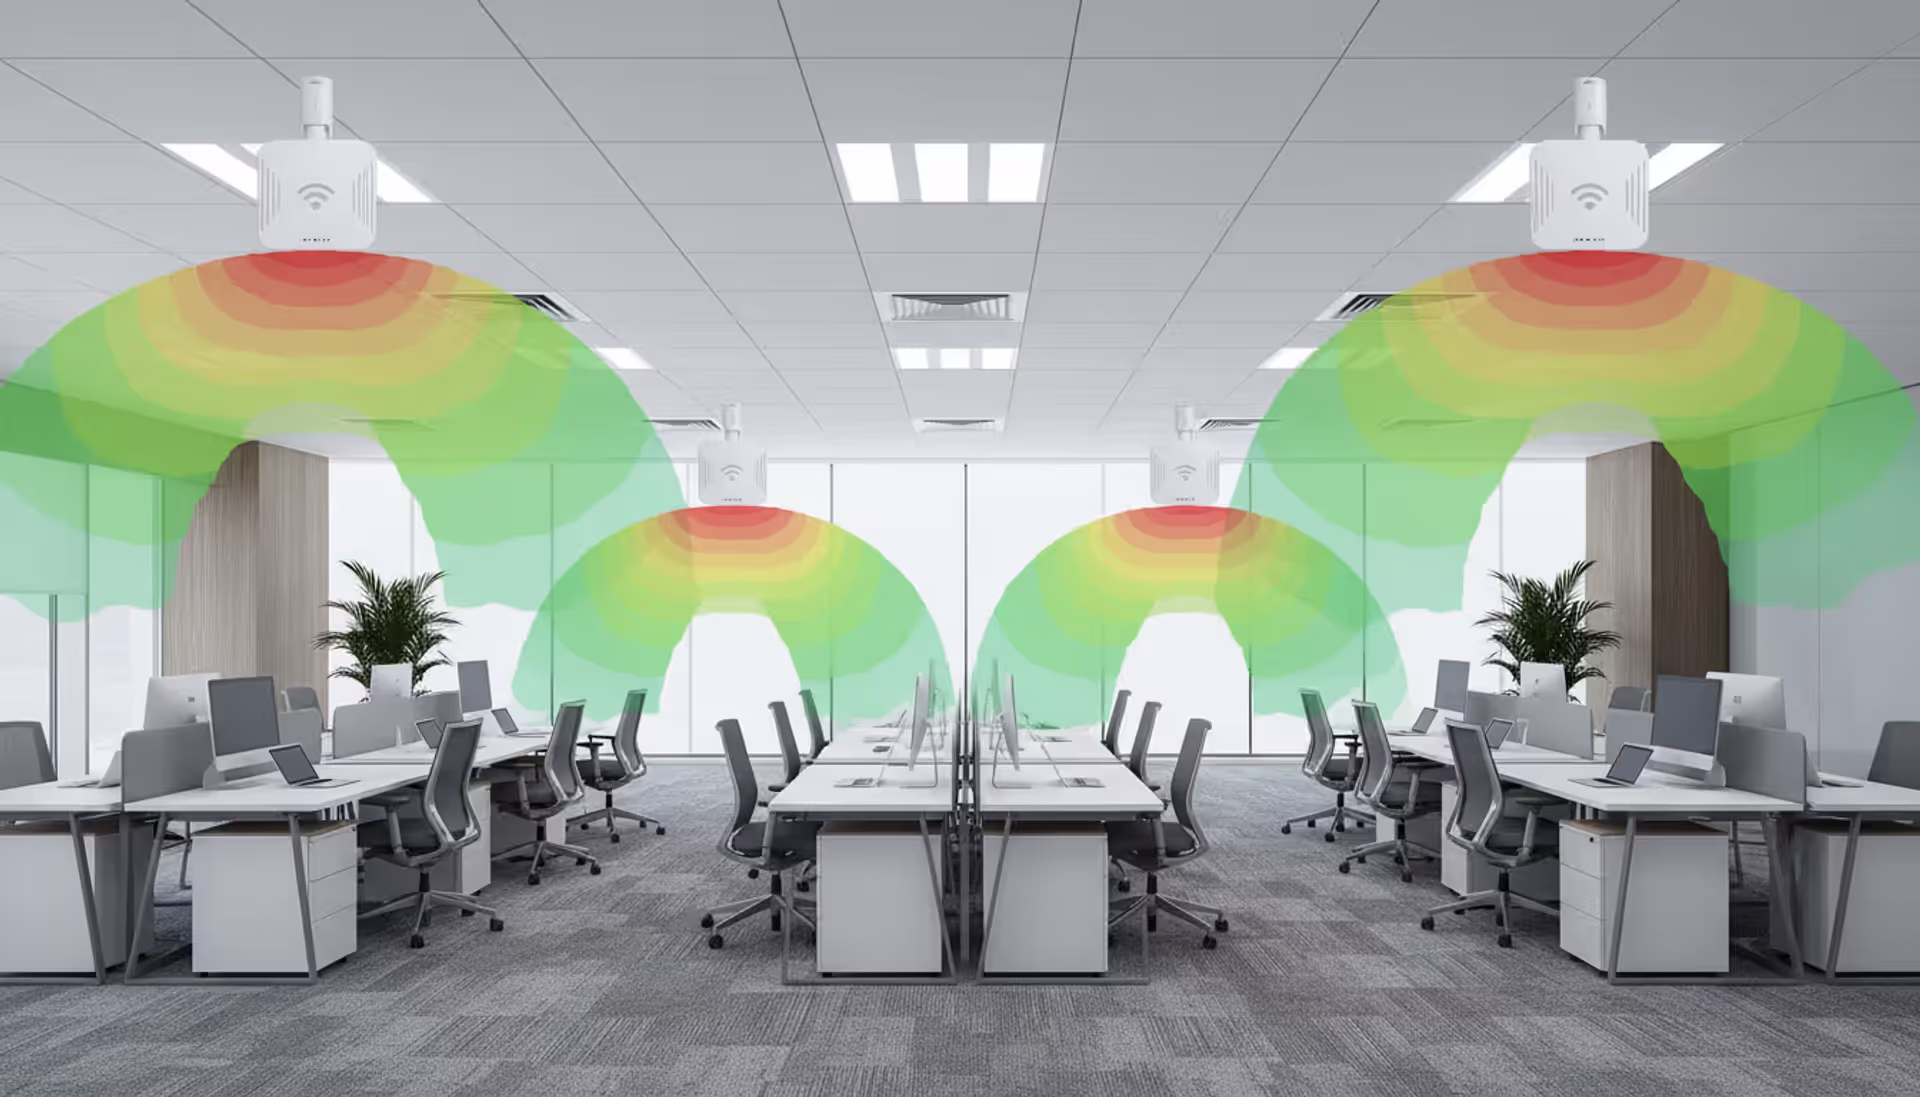
Deploying wireless networks without planning software risks coverage gaps and expensive rework. This guide explains how RF modeling tools predict signal behavior, recommend access point placement, and validate designs before installation—saving time and money across small business and enterprise deployments
Network downtime costs US businesses $9,000 per minute. This comprehensive guide covers network management fundamentals, deployment models, key features, provider selection, and solutions to common challenges for modern IT infrastructure
Network diagrams map how devices connect and communicate in your infrastructure. This guide covers everything from basic diagrams to professional documentation, including tool selection, templates, and best practices that prevent costly troubleshooting delays
Load balancing distributes network traffic across multiple servers to prevent overload, improve performance, and ensure high availability. This guide covers load balancing methods, compares hardware vs software vs cloud solutions, and explains how to choose the right tools for your infrastructure needs
The content on this website is provided for general informational and educational purposes only. It is intended to explain concepts related to cloud computing, computer networking, infrastructure, and modern IT systems.
All information on this website, including articles, guides, and examples, is presented for general educational purposes. Technology implementations may vary depending on specific environments, business needs, infrastructure design, and technical requirements.
This website does not provide professional IT, engineering, or technical advice, and the information presented should not be used as a substitute for consultation with qualified IT professionals.
The website and its authors are not responsible for any errors or omissions, or for any outcomes resulting from decisions made based on the information provided on this website.