A network administrator walks into the server room at 3 AM to troubleshoot a critical outage. Without an accurate network diagram, what should take 20 minutes stretches into hours of tracing cables and guessing connections. This scenario plays out in organizations daily, costing time, money, and sanity.
Network diagrams serve as blueprints for digital infrastructure. They map how devices connect, communicate, and depend on each other. Whether you manage a small office network or architect enterprise systems spanning multiple data centers, understanding how to create and maintain these visual representations separates efficient operations from chaotic firefighting.
What Is a Network Diagram and Why It Matters
A network diagram is a visual representation showing how computers, servers, routers, switches, and other devices interconnect within a network infrastructure. Think of it as a roadmap for data flow—showing not just what equipment exists, but how information travels between components.
These diagrams serve multiple critical functions across IT and business operations. During troubleshooting, they let technicians quickly identify potential failure points without physically inspecting every connection. When planning upgrades, they reveal capacity constraints and bottlenecks before you spend budget on new equipment. For compliance and security audits, they document network architecture and demonstrate proper segmentation between sensitive systems.
Project managers rely on network diagrams differently than IT staff. In project management contexts, these diagrams map task dependencies and timelines, showing which activities must complete before others can begin. The underlying principle remains identical: visualizing relationships between components to understand the whole system.
Security teams use network diagrams to identify vulnerable entry points and verify firewall placement. When a breach occurs, the diagram becomes the tactical map for incident response. Without it, defenders operate blind while attackers already know the terrain.
The business case for maintaining current network diagrams extends beyond IT. Insurance policies may require them for coverage. Mergers and acquisitions depend on them for due diligence. Remote work arrangements need them to provision secure access. The documentation you create today prevents expensive problems tomorrow.
Types of Network Diagrams You Should Know
Network diagrams split into two fundamental categories: logical and physical. Physical diagrams show the actual geographic layout—which devices sit in which rooms, how cables run through walls, rack positions in data centers. They answer "where is it?" questions. Logical diagrams ignore physical location and focus on how data flows between devices, showing IP address schemes, VLANs, routing protocols, and traffic patterns. They answer "how does it work?" questions.
Most organizations need both types. A facilities manager replacing ceiling tiles needs the physical diagram to avoid cutting through network cables. A network engineer configuring VLANs needs the logical diagram to understand traffic segmentation.
Author: Ethan Norwood;
Source: baltazor.com
Beyond this primary split, diagrams vary by network scope and topology. LAN (Local Area Network) diagrams map connections within a single building or campus. WAN (Wide Area Network) diagrams show how geographically dispersed locations connect through internet links, MPLS circuits, or VPN tunnels. Cloud infrastructure diagrams have emerged as a distinct category, mapping virtual networks, availability zones, and service dependencies across AWS, Azure, or Google Cloud platforms.
Topology types describe the fundamental shape of network connections. Star topology places a central switch or router with devices radiating outward—the most common pattern in modern offices. Mesh topology creates multiple redundant paths between devices, common in wireless networks and high-availability systems. Ring topology connects devices in a circular chain, less common now but still found in some industrial control systems. Bus topology shares a single communication line, mostly obsolete except in legacy systems.
Hybrid topologies combine multiple patterns. A typical enterprise network uses star topology at the access layer (user devices to switches), mesh at the core (between primary routers for redundancy), and star again connecting to branch offices.
How to Create a Basic Network Diagram
Creating a basic network diagram starts with inventory, not drawing. List every device that connects to your network: computers, printers, phones, IoT devices, security cameras, access points. Document switches, routers, firewalls, and servers. Note internet connections and connections to external networks.
Next, map the relationships. Which devices connect to which switches? Which switches connect to which routers? Where does internet access enter the building? This detective work takes longer than the actual drawing, especially if you inherited an undocumented network.
Choose your scope carefully for the first diagram. A complete enterprise network might overwhelm you. Start with a single floor, department, or network segment. Success with a manageable scope builds momentum for larger projects.
Author: Ethan Norwood;
Source: baltazor.com
Common Symbols and Notations
Standardized symbols ensure anyone familiar with network diagrams can interpret yours. A cloud shape represents the internet or external networks. Rectangles typically indicate servers. Circles or small rectangles show workstations. A cylinder represents databases. Switches appear as rectangular boxes with arrows indicating ports. Routers use a circular symbol with four arrows pointing outward.
Firewalls use a wall or brick pattern symbol. Wireless access points show radio waves emanating from a device. Lines between symbols represent connections—solid lines for wired connections, dashed lines for wireless. Different line colors can indicate different VLANs or network segments.
Cisco, Microsoft, and AWS each publish icon sets for their equipment. Using vendor-specific icons adds detail but may confuse readers unfamiliar with those symbols. For general-purpose diagrams, generic standardized symbols work better.
Label everything. Device names, IP addresses, port numbers, VLAN IDs, link speeds—the information you include depends on the diagram's purpose. A high-level overview for executives needs less technical detail than a troubleshooting reference for engineers.
Step-by-Step Creation Process
Start with the internet connection or primary router at the top or center of your canvas. This anchor point establishes the hierarchy. Add the core network devices next—primary switches, firewalls, main servers. These form the backbone.
Work outward in layers. Add distribution switches that connect to the core. Then access switches where end devices connect. Group related devices together—all servers in one area, all user devices in another, all network infrastructure in a third section.
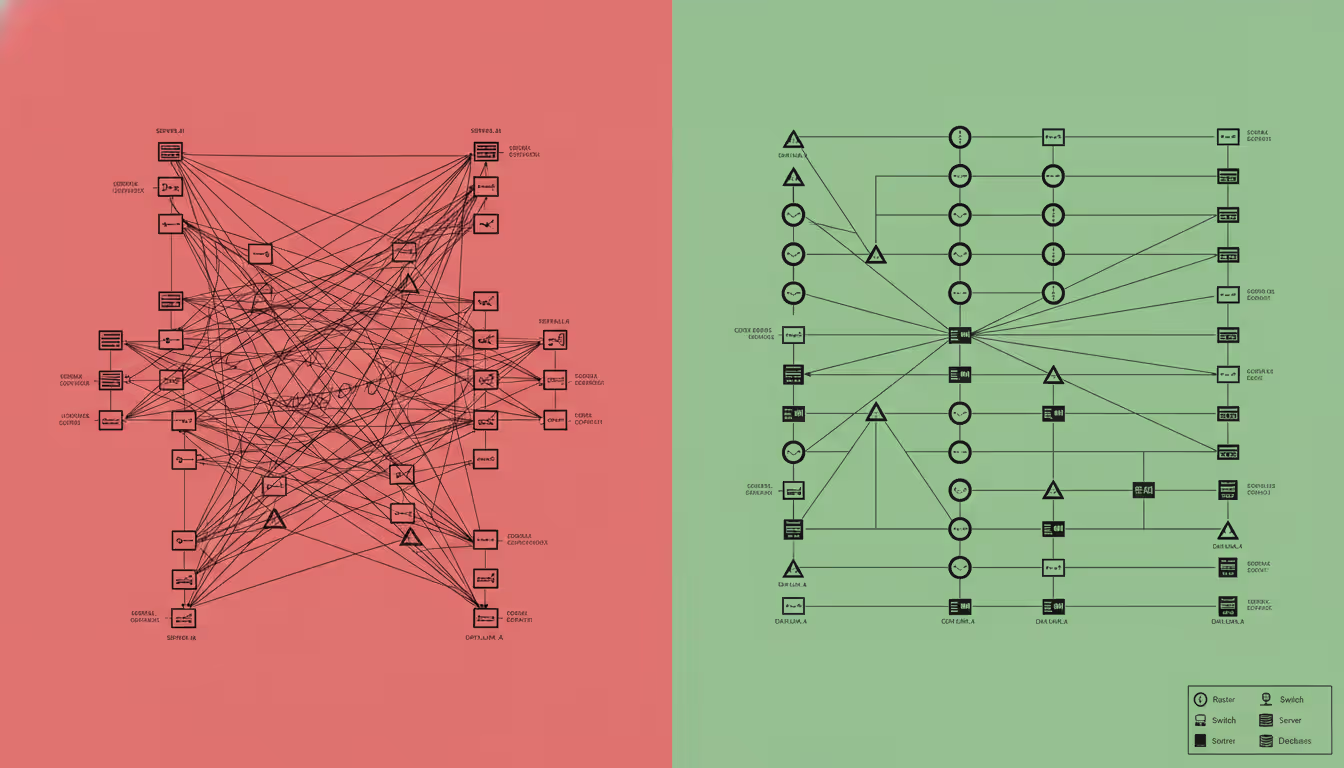
Keep lines clean. Avoid crossing connection lines when possible. When crossings are unavoidable, use a small bridge symbol or break one line to show it passes over the other. Minimize diagonal lines—horizontal and vertical connections create cleaner diagrams.
Add a legend explaining symbols, colors, and abbreviations. Include creation date and version number. Note who created the diagram and who to contact with questions. This metadata seems trivial until someone finds your diagram three years later and needs context.
Review for completeness. Walk through common scenarios: what happens when a user can't access the internet? Can you trace the path from their computer through switches and routers to the firewall? If someone unplugs a specific switch, which devices lose connectivity? Your diagram should answer these questions visually.
Choosing the Right Network Diagram Tool
The right network diagram tool balances capability with complexity. Powerful features mean nothing if the learning curve prevents actual use. Consider who will create and maintain diagrams—dedicated network engineers tolerate complexity that occasional users won't.
Ease of use matters most for small teams without dedicated documentation staff. Drag-and-drop interfaces, built-in symbol libraries, and automatic layout features reduce friction. Look for tools that snap connections to device ports and automatically route lines around obstacles.
Collaboration features determine whether diagrams become team assets or individual files trapped on someone's laptop. Cloud-based tools with real-time collaboration let multiple people work simultaneously. Version history shows who changed what and when. Comment threads let reviewers suggest improvements without editing directly.
Template libraries accelerate creation. Rather than starting from scratch, modify an existing template for similar network types. Quality matters more than quantity—ten well-designed templates beat a hundred generic ones.
Export options affect diagram utility. PDF export creates shareable documents. PNG or SVG export embeds diagrams in documentation. Some tools integrate with IT service management platforms, automatically updating diagrams when network changes occur.
Pricing models range from free open-source tools to enterprise subscriptions costing thousands annually. Free tools work fine for small networks but may lack advanced features like automated discovery or integration with monitoring systems. Mid-range tools ($10-50 per user monthly) offer good feature sets for most organizations. Enterprise tools justify their cost through automation, integration, and support for massive networks.
Desktop versus online tools present trade-offs. Desktop applications work offline and may feel more responsive, but require installation and updates on each computer. Online tools work from any browser without installation but need internet connectivity and may have performance limits with very large diagrams.
Tool
Pricing
Platform
Template Library
Collaboration
Best For
Lucidchart
$7.95-$9/user/month
Online
1000+ templates
Real-time editing, comments
Teams needing cloud collaboration
Microsoft Visio
$5-$15/user/month
Desktop/Online
250+ templates
SharePoint integration
Microsoft-centric organizations
Draw.io (diagrams.net)
Free
Online/Desktop
100+ templates
Google Drive/OneDrive sync
Budget-conscious users
SolarWinds Network Topology Mapper
$1,495 one-time
Desktop
Auto-discovery
Export to Visio
Automated discovery needs
Creately
$5-$8/user/month
Online
1000+ templates
Real-time collaboration
Visual collaboration focus
Network Diagram Template Options and When to Use Them
Templates solve the blank-canvas problem. Starting with a pre-built structure lets you focus on customizing details rather than fundamental layout. Most network diagram tools include templates for common scenarios.
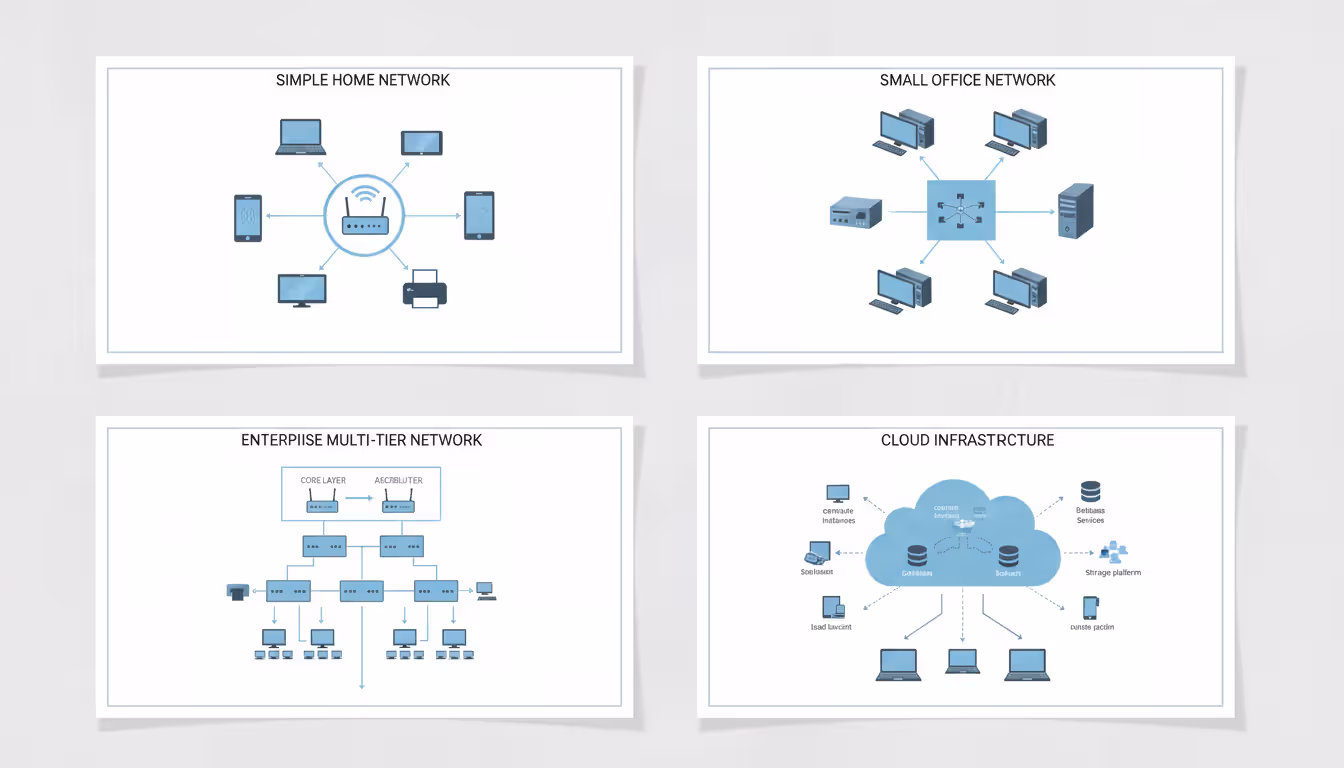
Home network templates show a simple structure: internet modem connecting to a wireless router, with computers, phones, smart TVs, and IoT devices connecting wirelessly or through Ethernet. These templates work for home offices or small retail locations with minimal infrastructure.
Small business templates add complexity: a firewall between the internet and internal network, a managed switch connecting multiple devices, separate wireless access points for better coverage, a server for file sharing or applications. These templates suit businesses with 5-50 employees.
Author: Ethan Norwood;
Source: baltazor.com
Enterprise templates show hierarchical designs: redundant internet connections, core switches with multiple distribution switches, separate VLANs for different departments or security zones, dedicated servers for various functions, disaster recovery connections to backup sites. Organizations with 100+ employees or complex security requirements need this level of detail.
Cloud infrastructure templates map virtual networks rather than physical hardware. They show VPCs (Virtual Private Clouds), subnets, security groups, load balancers, and connections between cloud services. Hybrid cloud templates add connections between on-premises data centers and cloud resources.
Data center templates focus on rack layouts and high-density equipment. They show top-of-rack switches, blade chassis, storage arrays, and cable management. These templates help plan capacity and power requirements.
Customize templates by replacing generic device names with your actual equipment, adjusting IP address schemes to match your network, adding or removing devices based on your infrastructure, and changing colors or symbols to match your organization's documentation standards.
Don't force your network into an inappropriate template. If a template requires extensive modification, starting from scratch may be faster and produce clearer results.
Best Practices for Professional Network Diagrams
Clarity trumps comprehensiveness. A diagram showing every single device and connection becomes an unreadable mess. Create multiple diagrams at different detail levels: a high-level overview showing major segments and connections, mid-level diagrams for each department or location, and detailed diagrams for complex subsystems.
Consistency across diagrams prevents confusion. Use the same symbols for the same device types. Apply the same color scheme—perhaps blue for user networks, red for management networks, green for guest networks. Place internet connections in the same position (typically top-center) on every diagram.
Documentation standards formalize these choices. Write a one-page guide specifying which symbols represent which devices, what colors mean, how to label devices, and where to store completed diagrams. New team members follow this guide to maintain consistency.
Version control prevents the "which diagram is current?" problem. Include version numbers and dates on every diagram. Store old versions in an archive rather than deleting them—sometimes you need to see how the network looked six months ago. Some teams use semantic versioning: major version numbers for significant network redesigns, minor numbers for adding or removing devices, patch numbers for corrections or clarifications.
Security considerations affect what you include and who can access diagrams. Detailed network diagrams reveal attack surfaces—showing firewall rules, server locations, and network segmentation helps attackers plan intrusions. Store diagrams securely with access limited to IT staff and executives who need them. Redact sensitive details from versions shared with contractors or third parties.
Update diagrams immediately after network changes, not "when you have time." That moment never arrives, and outdated diagrams cause more problems than missing diagrams. Make diagram updates part of your change management process—no change request completes until documentation reflects the new configuration.
Add context through annotations. A note explaining why a particular device connects directly to the core switch rather than through normal hierarchy prevents future questions. Document known issues or planned changes. These annotations transform diagrams from static pictures into living documentation.
A network diagram is only as valuable as it is accurate. I've seen organizations spend thousands on sophisticated diagramming tools while their actual documentation was six months out of date. The discipline to update diagrams immediately after changes matters more than which tool you use
— Jennifer Martinez
Common Mistakes to Avoid When Diagramming Networks
Overcomplicated layouts defeat the diagram's purpose. If you need ten minutes to find a specific device, the diagram fails. Resist the urge to show every detail on one diagram. Create separate diagrams for different purposes: one for physical layout, another for logical connections, a third for security zones.
Missing labels create ambiguity. Which of the five identical server icons represents the email server? Without labels, people guess wrong. Label every device with at least a name or function. For technical diagrams, add IP addresses, model numbers, or serial numbers.
Inconsistent symbol use confuses readers. If circles represent workstations on one part of the diagram but servers on another, people misinterpret your network. Pick symbols and stick with them. When you must use a non-standard symbol, add it to the legend with explanation.
Outdated diagrams are worse than no diagrams. They provide false confidence, leading technicians to make decisions based on incorrect information. A troubleshooter who believes a redundant connection exists (because the old diagram shows it) wastes time investigating why failover didn't work—only to discover the backup link was removed months ago.
Author: Ethan Norwood;
Source: baltazor.com
Ignoring scalability creates rework. Your ten-device network will grow. Leave white space for future additions. Use a layout that accommodates expansion without complete reorganization. Consider how the diagram handles doubling or tripling device count.
Poor visual hierarchy makes diagrams hard to parse. Important core infrastructure should stand out through size, position, or color. Edge devices should be visually subordinate. The viewer's eye should naturally follow the path from internet connection through firewalls and routers to end devices.
Forgetting the audience causes mismatches between diagram detail and viewer needs. Executives want high-level overviews showing major components and costs. Technicians need detailed diagrams with IP addresses and port numbers. Security auditors need diagrams highlighting segmentation and access controls. One diagram rarely serves all audiences—create versions targeted to specific needs.
Neglecting the legend assumes too much knowledge. Symbols obvious to you may mystify others. Colors that clearly indicate different VLANs to a network engineer mean nothing to a facilities manager. Always include a legend explaining symbols, colors, line styles, and abbreviations.
Frequently Asked Questions
What is the difference between a logical and physical network diagram?
Physical network diagrams show the actual geographic layout of devices—which equipment sits in which rooms, how cables run through buildings, and the physical connections between devices. Logical network diagrams ignore physical location and instead map how data flows through the network, showing IP addresses, subnets, VLANs, and routing protocols. You need physical diagrams for tasks like cable installation or equipment relocation. You need logical diagrams for troubleshooting connectivity issues or planning security segmentation.
Do I need special software to create a network diagram?
No special software is required. You can create basic network diagrams using general-purpose tools like Microsoft PowerPoint, Google Slides, or even pen and paper. However, dedicated network diagram tools offer significant advantages: libraries of standard network symbols, automatic line routing, templates for common network types, and features like automatic device discovery. For occasional use or very simple networks, general tools suffice. For regular documentation or complex networks, dedicated tools save substantial time.
Can I create a network diagram online for free?
Yes, several quality tools offer free options. Draw.io (also called diagrams.net) provides full-featured diagramming completely free, with files stored in Google Drive, OneDrive, or locally. Lucidchart offers a free tier with limited diagrams and features. Creately provides a free plan with restrictions on diagram count. These free tools handle most small business needs. Limitations typically involve the number of diagrams you can create, collaboration features, or advanced capabilities like automated network discovery.
How detailed should a basic network diagram be?
A basic network diagram should show all devices that connect to the network (computers, printers, phones, servers), all network infrastructure (routers, switches, firewalls, access points), and the connections between them. Include device names or functions and the internet connection point. You can omit technical details like IP addresses, VLAN numbers, or port assignments from basic diagrams—those belong in more detailed technical diagrams. The test: can someone unfamiliar with your network understand the overall structure and identify major components?
What are the most common network diagram templates?
The most common templates include home network (modem, router, and connected devices), small office network (firewall, switch, server, and workstations), enterprise network (with core/distribution/access layer hierarchy), wireless network (access points and coverage areas), rack layout (equipment in data center racks), and cloud infrastructure (virtual networks and cloud services). Many tools also offer templates for specific scenarios like VoIP systems, video surveillance networks, or point-of-sale systems.
How often should I update my network diagram?
Update your network diagram immediately whenever you make changes to the network—adding or removing devices, changing connections, modifying IP addresses, or reconfiguring network equipment. Waiting to update "later" means diagrams quickly become outdated and unreliable. Build diagram updates into your change management process. Additionally, review all diagrams quarterly even if no changes occurred, verifying accuracy and fixing any errors discovered during normal operations.
Network diagrams transform invisible digital infrastructure into visible, understandable maps. They accelerate troubleshooting, improve planning, satisfy compliance requirements, and preserve institutional knowledge when team members leave.
The best network diagram is the one that exists and stays current. Sophisticated tools and perfect layouts matter less than the discipline to create documentation and keep it updated. Start simple—diagram one network segment today. Use whatever tool you have available. Focus on accuracy over aesthetics.
As your network grows, your diagrams will evolve. The basic diagram you create this week becomes the foundation for more detailed documentation later. Each diagram you maintain prevents future problems and saves time during inevitable outages or changes.
Treat network diagrams as living documents, not one-time projects. Review them regularly. Update them immediately after changes. Share them with everyone who needs them. The investment in documentation pays returns every time someone troubleshoots an issue in minutes instead of hours, or plans an upgrade without discovering surprise limitations halfway through implementation.
Deploying wireless networks without planning software risks coverage gaps and expensive rework. This guide explains how RF modeling tools predict signal behavior, recommend access point placement, and validate designs before installation—saving time and money across small business and enterprise deployments
Network topology defines how devices connect and communicate in your infrastructure. This guide covers topology types (star, mesh, ring, tree, hybrid), creating accurate network topology diagrams, choosing mapping tools, and avoiding common planning mistakes that impact performance and reliability
Network downtime costs US businesses $9,000 per minute. This comprehensive guide covers network management fundamentals, deployment models, key features, provider selection, and solutions to common challenges for modern IT infrastructure
Load balancing distributes network traffic across multiple servers to prevent overload, improve performance, and ensure high availability. This guide covers load balancing methods, compares hardware vs software vs cloud solutions, and explains how to choose the right tools for your infrastructure needs
The content on this website is provided for general informational and educational purposes only. It is intended to explain concepts related to cloud computing, computer networking, infrastructure, and modern IT systems.
All information on this website, including articles, guides, and examples, is presented for general educational purposes. Technology implementations may vary depending on specific environments, business needs, infrastructure design, and technical requirements.
This website does not provide professional IT, engineering, or technical advice, and the information presented should not be used as a substitute for consultation with qualified IT professionals.
The website and its authors are not responsible for any errors or omissions, or for any outcomes resulting from decisions made based on the information provided on this website.